https://twitter.com/carolinefwright/status/1157219572514209792
The original intention was to add this as a comment in the Disqus comment in the original pre-print discussion. However, I thought this was fairly long, and I wanted to be able to have a little more control over figure formatting.
For reference, I recommended taking a look at Illumina arrays in an earlier comment, and I mentioned there there are datasets with both 23andMe SNP chip data and high-throughput sequencing data (like myself).
As a success story, that comment was followed up on, and new data was added. In particular, there was a plot of the error/discordance rate between my own 23andMe data and my Veritas WGS data posted on Twitter.
I think this is great, but I think it may be worth emphasizing that re-processing my Veritas WGS data resulted in better concordance with my Exome data. Additionally, I have an upgraded V5 chip, so there are actually 2 sets of 23andMe Data (although almost all of these results are based upon my later set of V3_V5 genotypes).
Nevertheless, I actually have 2 .vcf files for my Veritas WGS data (the provided .vcf, and the .vcf that I produced from extracted FASTQ files and reprocessed using BWA-MEM and GATK).
I did some analysis with my V3 23andMe genotypes, but I think that was mostly consistent with my V3_V5 genotypes. Among probes on both arrays, there were only 5 discordant sites (so, I think that is how the previously lower error rate was reported: SNP chip versus same SNP chip, instead of SNP chip versus WGS).
In contrast, even the best-case scenario for my data seems to have concordance of 97.6-99.2% (with MAF > 0.01 variants), and this was slightly lower for the V3_V5 genotypes. If I only considered my original V3 genotypes, this would have been better than I had previously reported for my Exome versus WGS data (98-99% for BWA-MEM + GATK re-processed variants). However, either way, there are over a million probes on the V5 23andMe array. So, I think something about variants being used for “research purposes” may be relevant (although I will show below that certain sets of variants do have higher reproducibility).
The trends can vary depending upon what I use for the MAF calculation:
1000 Genomes:


gnomAD:


Kaviar:


I am showing 2 plots each because I have 2 .vcf files for my WGS data (the one provided by Veritas, and the BWA-MEM + GATK re-processed variant file). While the results are above are mostly similar with either Veritas WGS .vcf, there are some noticeable differences in the exact set of rare variants with different population estimates (which could either be because of the composition of individuals, or with the different sample processing strategies for each project).
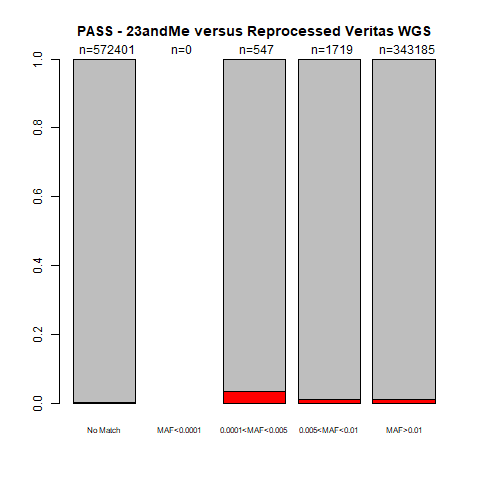
When I converted my 23andMe to VCF format, I added a “PASS” status (to keep track of variants within repeats, for example). If there was no other note, the variant had a “PASS” in the FILTER column. If I only consider “PASS” variants, this is what those plots look like:
1000 Genomes:

gnomAD:


Kaviar:


If I only consider the “PASS” variants, the accuracy also increases a little (from 98.8-99.7% for my initial V3 genotypes, and 98.009-99.997% with the range of MAF for my V3_V5 genotypes), usually in the far-left column.
Finally, if I start from the full set of variants, but I only look at those that were discordant between my WGS .vcf files, I see better concordance for re-processed variants if they are common (but the trend for the smaller variant sets can vary):
1000 Genomes:


gnomAD:


Kaviar:


For these plots, the largest number of variants are in the far-right column. Since that far-right column usually has less SNP chip discordance (less red in the barplot), that is consistent with my earlier conclusion that re-processing the WGS data could produce variants with higher overall concordance (in that situation, between Exome and WGS data). However, this can clearly vary between individual variants/positions (and the best processing strategy may vary depending upon where you need to be calling variants).
I can't really visualize the SNP chip data, and I kind of have to trust the "NC" status for "No Call" positions (and I don't have access to a more raw form of data, like the intensities).
However, as a general rule, I would always recommend checking your alignments for false negatives or false positives (which you can do with a free genome browser like IGV). I added some ClinVar annotations to try and find some discordant sites to check, and I've listed a couple below:
1) I was surprised that my re-processed was missing my cystic fibrosis variant (which I have a whole other post about). However, this was purely a formatting issue.
Namely, I threw out most indel positions (indicated by DI) because figuring out exactly what that represents is more difficult than for the SNPs. However, with my earlier V3 chip analysis, I manually converted some indels in my code (including my cystic fibrosis indel). However, I converted to match the freebayes indel format in the provided .vcf for the .
In the other blog post, you can clearly see that I am a cystic fibrosis carrier, even with the re-alignment. So, I looked up the GATK format for that indel and checked the status of that variant. Indeed, I do have a variant call for chr7 117149181 . CTT C. So, this is in fact OK (as long as the annotation software can figure out I have the variant, which I think was part of the problem described in the other blog post).
2) While it wasn't a discordant site between .vcf files, there were only a limited number of total ClinVar pathogenic variants. So, I happened to notice one that indicated I was homozygous for the pathogenic variant in my 23andMe data (1/1) but a variant was not called at that position with either of the Veritas WGS .vcf files (indicated by a 0/0 in the genotype columns). In other words, the SNP chip data was consistent with a SNP chip replicate, the WGS variant was robust different processing methods, but the result was different for SNP chip versus WGS.
However, I can check the alignments for both the provided and reprocessed WGS data (as well as provided and reprocessed Exome data), which is what I do below:

The plot above shows alignments in the following order (top to bottom): Genos Exome Provided, Genos Exome Reprocessed, Veritas WGS Provided, Veritas WGS Reprocessed
So, from the alignments, I would be inclined to agree with the WGS variant calls. If there is some isoform of the gene that is so far diverged the reads wouldn't align, that could be an exception. However, I don't think that situation would be best described as a SNP. Also, I don't believe any reports indicated that I had predisposition to Neurofibromatosis (and I don't know anybody in my family that was diagnosed with that disease). This was a custom 23andMe probe (labeled as i5003284, instead of a typical rsID). However, the larger ANNOVAR annotation file has the ClinVar information, and I can find a dbSNP ID using the UCSC Genome Browser (for hg19, chr17:29541542). So, in terms of checking the ANNOVAR annotation, if I actually did have two copies of an NF1 pathogenic variant, rs137854557 does have multiple reports indicating it being pathogenic (less of a confident assertion than my cystic fibrosis variant, but more than most of my other "pathogenic" variants).
As a final note, the data and code for analysis of my V3_V5 23andMe genotype data (and 2 Veritas WGS .vcf files) is available here.
Update Log:
8/10/2019 - public post date
1/15/2020 - add tag for "Converted Twitter Response"
1/15/2020 - add tag for "Converted Twitter Response"


This comment has been removed by a blog administrator.
ReplyDelete