Wednesday, December 18, 2019

Review of Results / Data from 3 Cat DNA Organizations / Companies

NOTE: If this post is too wordy and/or contains too many details for a broader audience, then I would recommend viewing this YouTube video (from somebody else, with a different cat).  However, those comparisons do not consider the UC-Davis VGL (Veterinary Genetics Laboratory) report or the Whole Genome Sequencing results (from Basepaws).  So, if you might be interested in information for those other options, then I hope this blog post may be useful!  Nevertheless, I think some main messages are similar with an independent assessment.

Back in 2012/2013, I checked out the UC-Davis VGL Cat Ancestry test for Stormy the Scottish Fold (which I described in this blog post).

However, Stormy is not my cat.  So, I decided to test my cat (Bastu) for a few different options out there for the general public.  While more recently expanded, this started from notes that you can see on this GitHub page (including subfolders for most of the raw basepaws analysis).  I am also continuing to upload updated basepaws reports there.


UC-Davis VGL (Cat Ancestry, $120)

  • You can see Bastu's VGL report here
  • I would recommend visiting the VGL cat website to learn more about the genetic tests (often used across companies).
  • I also like that trait information is provided for specific variants, most directly related to the phenotypes of interest.
  • So, I think "Cat Ancestry" is a nice brief report, which also includes checking for some mutations associated with traits (sometimes for a trait defining a breed).
  • Saliva sample collected with cytobrushes.
  • In terms of ancestry, I think these tend to be the most robust results in terms of "Eastern" versus "Western" ancestry (some people on the basepaws discussion forum didn't initially like them because lack of detail, but I believe some of the more "interesting" results may be less robust and/or are commonly misunderstood).
  • At least when I ordered the kit, I think this option has the longest turn-around time (I noted that the last kit had a turn-around time of a little more than 3 months).
Also, if you didn't click the PDF link above, here is a screenshot of the main part of that report:


basepaws lcWGS + Amplicon-Seq (regular price $149)

  • The more recent reports are interactive (where I "printed" a PDF to download), and you might want to download the files (selecting the green "Code" button and then "Download ZIP") from GitHub link to view the full names for all of those files.
    • Nevertheless, you can see various versions of Bastu's reports here.
  • For either sample type, I liked the basepaws Facebook discussion group (Basepaws Cat Club), to become part of a community with other cat lovers.
    • The text related to reports to the reports can often make me feel uneasy, and I have been working on resisting commenting about that as often (since I don't want to say nothing at any point, but I also don't want to harass the other customers).
    • However, posts that focus on seeing other people's cats is something nice that is helpful in making my day a little better.
  • I also like the vibe of the company, in terms of having a blog and fun merchandise
    • For example, I purchased a Whiskers Face Mask for myself (but please note I had an extra $4 for shipping, and I didn't initially notice that it said "basepaws" in small font).  I have some face masks, but I thought this looked extra fun!
  • Sample previously collected with material like packing tape (for hair), but more recent sample collected with foam swab with preservation material (for saliva)
    • The foam swab is supposed to be inserted into the cat's mouth for 5 seconds
  • This may change in the future, but I also have some concerns about the representation of the company and timing/expansion of company offering.  I would no longer have concerns if this was changed, but there are multiple examples of this:
    • As one example, at least currently, I think they need to add the word "consumer" to their CatKit box (for example, the VGL results were clearly available earlier).  However, if this is changed, then I no longer have this concern.
      • On the plus side, I believe the need to do this has been acknowledged.  However, I think it has still not been added the to the box for the kits.
      • To be clear, I think pretty much everything in this post would benefit from continual evaluation/verification, and drawing similar conclusions from independent data/experiments is important.  
      • So, the point is not to emphasize whomever is "first" so much as not being able to say that you were first (and there being evidence against making this specific claim).
    •  As another example, under "About Basepaws," the Cat Behavior Summit website says "Basepaws is a leader in feline health, providing world's first at-home genetics and biome testing with digital results available in weeks."  Again, basepaws did not offer the first at-home genetics testing for cats.  Additionally, there are currently no biome testing results in the report (at the time that information was posted - I do currently have a metagenomics report for my regular coverage sequencing data).
      • It is possible to do microbiome/metagenomic analysis with low coverage Whole Genome Sequencing (lcWGS) results,  but I do not believe it is accurate to say this in the present tense.
        • I have been notified as a plan for basepaws to add a dental health test. I did see a similar number (50-90%) reported on this page for cats, and an estimate of 77% on this page would also be overlapping (for the broad category).
        • Again, for any level of severity, if you count 50-70% as being similar, then that overlaps what is reported here and perhaps pages 10-11 of this report.
        • However, I think the claim about prevalence looks different than I see in this paper on dogs. Likewise, I can also see this paper where the prevalence is more similar to what I saw in cats (10-15% for periodontal disease, which was in fact reported as being the most common specific disease)
        • Possibly somewhere in between, in this paper, there was a fraction of overall "dental" problems being reported in the abstract is ~30%.
        • I don't see dental problems listed on this ASPCA page, (or, I believe, this Wikipedia page).  So, I am not sure what to think about that.
        • I will continue to gradually look into this more, but the "periodontal disease stage" for dogs (and stage I, for cats) in the 2016 VCA report earlier (with a higher percentage for "dental tartar") seems like what I was expecting (with values <10% for stage I cats, and varying fractions by age for dog that are also all <10%).
        • Though this video, I have also learned about things like VOHC.
      • That said, if the raw data was provided for all kits, then I would be OK with those having enough familiarity/background to use open-source software can test different ways of looking at the data (with an understanding that you may not be able to make any confident claims about the interpretation of those results, and the customer base for that is probably more limited).
    • I also have some more specific scientific/technical concerns about the ancestry / breed results below.  So, I would say that there are still noticeable issues with what is currently being provided, before expanding into something more noticeably different.
    • That said, to be fair, and I have similar notes on human genomics companies (as well as discussions on the science-wide error rate with personal experiences and corrections / retractions on other papers).  So, I hope that shared experiences about past mistakes can help each of us learn the best way that we can help make the world a better place.
      • I myself am trying to figure how how to work on fewer projects in fewer depth that are ideally of good quality.  So, I think it is possible that a limit on the total number of commitments might be relevant on any time frame.
      • I think it is usually hard to be too nice, and I think compassion is important for managing your own stress as well as others. However, if these things were being done intentionally, then I think I should say that is somewhat different.  Either way, I also think paths to redemption need to be available to everybody.
  • I very much like that the likelihood of future changes in the report is often repeated basepaws, but there are some parts of the report that I have concerns about.
    • For example, I think the idea of hybrid breeds (like the Savannah) is genuinely interesting, but I think giving percentiles for the wild cat index to large cats (like tigers and cheetahs) is frequently giving consumers the wrong impression in terms of the biological significance of a result (and that percentiles can be defined for a completely random value, like a null distribution).
      • To further emphasize that the wildcat percentiles don't reflect absolute differences, you can see a phylogenetic tree from Wikipedia here.  For example, you can see all domestic cats should be more closely related to a cougar or a cheetah than a tiger or a leopard.  So, if your cat has tiger ranked first, then that doesn't mean that your cat is most closely related to tiger than the other 3 wildcats.
      • To be fair, the report does say "[these] results should NOT be interpreted as evidence that your cat is part wildcat".
    • I also have concerns with the specific breed index.
      • For example, I think the Savannah also provides a good example of my concerns with the domestic cat breed index (where the majority of customers with Savannah as their top breed probably don't have cats that descend from Savannah cats), and you can see some notes about that here.
      • I am also going to show you below how much this varies for technical replicates for my 1 cat.
      • In general, I think the Facebook discussion group has done a good job of providing examples of false positives and false negatives for using the breed index to define breeds.  
      • However, to be fair, there is a warning that "[the] Basepaws Breed Index is not a breed test, and can not tell exactly what breed your cat is.".
      • I also have a lengthier explanation on this specific point in a newer blog post, but I think a lot of the individual points are also mentioned in this post.
    • Also, as I mention in the Facebook discussion group, you can see some things that worked well for my human lcWGS data and some things that were unacceptable for my human lcWGS data.  I am also assuming that human variation is better understood than cat variation, which might relate to some of what I am about to show.  However, even for people, my country-specific AncestryDNA predictions of ~20% have confidence intervals that go down to 0%.
      • I think this is somewhat good in that it shows they understand the need to have the Amplicon-Seq for specific mutations (if using lcWGS).
      • However, if it was me, I would only provide Eastern-Western ancestry estimates and the relative finder functions (without providing genome-wide distances to purebred cats of unknown total number from reference set).

I also ordered a second lcWGS + Amplicon-Seq kit from basepaws for Bastu.  The mutation results and broad ancestry results were similar, but you can see differences in the exact values and top percentiles among technical replicates:


You can also see this report, which I submitted to FDA MedWatch.  However, please note that I do not believe that this was the right system for reporting for veterinary applications*.  I am following up to learn more, but I believe that you are supposed to fill out the PDF from this page and e-mail that to CVM1932a@fda.hhs.gov.  I think you may need to download the PDF, since it did not render correctly when viewed through my web browser.

To be fair, I wanted to compare the technical replicates compared at the same time.  While I think there are some noticeable improvements (such as providing a scale to switch to confident results and I think the percentiles have been removed), I think the point about the breeds might be even more clear:


You can see the top specific breed often changes.  I think some things are helped by switching to the confident assignments, even though that wasn't perfect.  I think seeing the top exotic result change between the confidence levels might help illustrate what I was saying about the problem with those assignments (such as the very rare Savannah):


I think there is still an issue with the chromosome painting (with the earlier problem explained below the footnotes), but it is the same issue that I encountered when I tried to run the analysis with public SNP chip data (which you can see at the middle of this post, for example).

In general, it seems like the broad ancestry groups are more robust than the specific breeds.  However, I thought it might be interesting that Maine Coon was the top Western breed if the confident results are selected (which might have matched the PCA plots that I showed above).  That said, you can hover / click the specific breeds to see the chromosomes for each breed.  So, the only specific chromosome that is common between the 2 technical replicates was chrB4.  However, Bastu is a carrier for the M3 long-hair marker, which is on chrB1.  So, these particular reports are not providing evidence that you can identify a segment that is similar to Maine Coon basepaws customers that includes Bastu's 1 copy (out of the needed 2 mutated FGF5 genes to cause long hair) of the M3 mutation in the FGF5 gene.  Plus, this is not true for my 15x sequencing report (Russian Blue is above Maine Coon).

Again, to be fair, basepaws makes clear that you should expect reports to be updated.  So, as long as you realize this (and don't take any action based upon the lcWGS results), I think this should be OK.  

That said, the relatively greater contribution of "Western" ancestry was robust (with the UC-Davis results and my custom re-analysis of the raw higher coverage basepaws WGS data).  For example, with an earlier report, if you sum the "Western" (39.2%) and "Persian" (12.4%) contributions from basepaws (51.6% broader "Western"), that is similar to the K=4 ADMIXTURE analysis that I performed on Bastu's higher coverage data (65% Western ancestry).  I believe a 10-15% difference in ancestry estimates is relatively similar (and the conclusions are qualitatively the same).

I also had concerns about the use of percentiles, but I don't believe this is in the most recent reports.  However, this may be conceptually useful for discussions about things like Polygenic Risk Scores, so I moved that content below the footnotes.

Similarly, I also moved down the content related to the earlier smaller segments below the footnotes (which had a different problem).


basepaws ~15x WGS (regular price $599)

  • I think this was supposed to be closer to ~20x, but please note that small fragments decrease the actual genomic coverage
  • There are links to download Bastu's raw FASTQ data from the GitHub page
  • This is my recommendation for getting raw data (for re-analysis)
    • I think you might technically be able to do with with a large enough donation to the 99 Lives project (not related to basepaws), but I think that is probably more about funding research than having a cost-effective way to get sequencing data.
    • If you were able to do sequencing on a lower-throughput machine through a DIYbio group, I think that would probably end up being more expensive.  However, I think that should be viewed more for training / education, rather than just getting raw data genomic data for your cat.
  • There was a fairly long time when I didn't have a report for this sample.  However, I more recently noticed that I can now download 3 reports, so I believe the report for my earliest sample was for the this higher coverage sequencing (as of 10/16/2020, you can view the PDF for "possible" results here and "confident" results here).
    • While I expect the individual variants / genotypes to be more accurate, I think there is still some room for improvement in the ancestry results (as I currently describe above for the lcWGS + Amplicon-Seq).
    • For example, it might be good that there is only "Western" and "Polycat" ancestry at the "confident" setting.  However, there are still some noticeable differences between my technical replicates in the last section (which I believe were the same on 10/16/2020, compared to the screenshots for an update for this blog post), including a change in the top breed (which expected was probably less robust / accurate).  Nevertheless, I think that the fact that the largest percentage (not on top)  was "Broadly Western" was a good sign.
    • In terms of the timing, my guess is that new customers probably won't have to wait as long to get the report (which I hope is updated as frequently as the others).
    • As a summary, I am showing some views of the 3 official basepaws reports below:

"Possible" Setting for basepaws ancestry report:


"Confident" Setting for basepaws ancestry report:


To be clear, all results that I  will now show below are custom analysis of raw data (and should not be expected for other basepaws customers).  For example, you can see a custom report that I created for Bastu here.  However, please note that the cost used to be higher, so I am listing what I paid (not the current price, which I have tried to update in the blog post).

For the custom re-analysis, one thing that I think is kind of neat is the separation that you can see between Eastern and Western reference samples (even with a relatively small number of probes on the cat SNP chip):


Even if there can be some improvement for the specific species, there is already some noticeable overlap if you try to separate the Persians from the Western cats.  However, what I thought might be possibly interesting is that Bastu was arguably slightly closer to the Maine Coon (and the UC-Davis VGL Cat Ancestry showed that she was an M3 carrier, which believe was found in a decent proportion of Maine Coons):


In terms of testing Bastu's mutations from UC-Davis, 2 out of the 3 showed reasonable validation:

Agouti (ASIP, a/a)


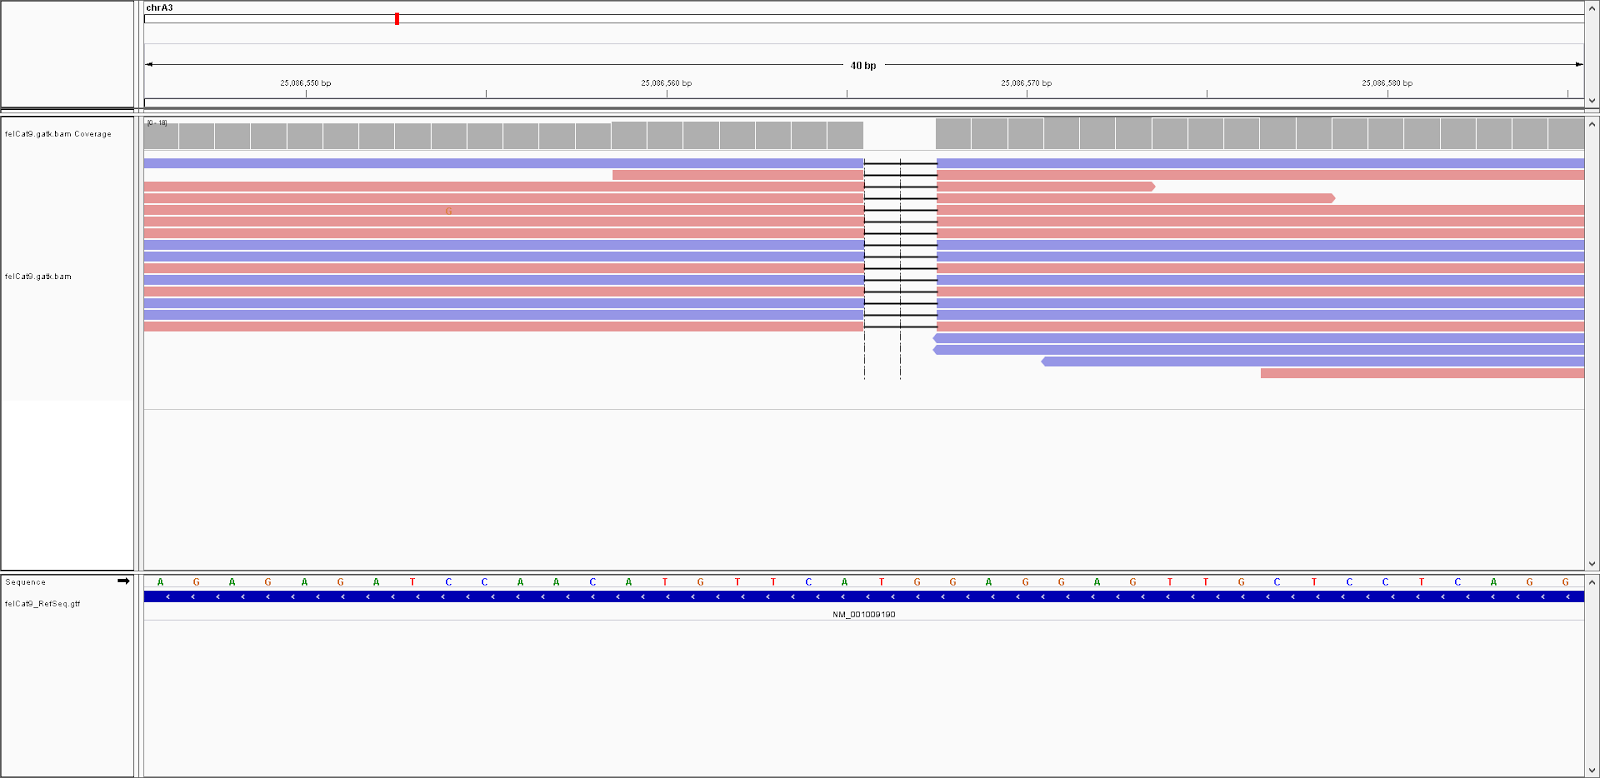
Long Hair (M3/N, FGF5)


I saw one read including the 3rd variant, although I am not sure why it was at so low frequency.  At least currently, I don't feel the strong desire to see if I can get something closer to 50% frequency with more starting DNA, but I can leave this as something to ponder for the future (and note that the UC-Davis VGL and Optimal Selection samples were also saliva samples patiently collected from Bastu's cat mouth, although the mechanism was slightly different).  Either way, her heterozygous status was validated on the 5th page of the Optimal Selection report (the 2nd page of the "Trait" section), so I believe this is her true genotype (and it's also possible the read ratio may improve with higher coverage).

Dilute (D/d, MLPH)


Optimal Selection / Wisdom Panel Feline (currently $99.99)


  • As I mention in my GitHub notesthe company name was a little confusing.
    • I also see "Mars" on a lot of the content provided through Optimal Selection, but perhaps this article about Optimal Selection for Dogs can give some extra context?
    • More recently, I noticed that I could only download a legacy PDF.  So, this might still be important, I moved my earlier screenshot below the footnotes.
  • You can see Bastu's report in PDF format here
    • At 2 weeks, this report has the fastest turnaround time
    • I also believe this provided the largest list of specific mutations (for traits and diseases)
  • I think it may be worth mentioning that the current (?) name of the company relates to selecting purebred cats for breeding.
    • In other words, I think the basis of this company is to essentially find the most genetically different cats among those that have the specific traits to define the breed (and/or are registered as a purebred cat) 
    • Even if you can get a little tighter clustering of specific breeds than I showed in the PCA plot above, I think this is somewhat more of an indication that the genome-wide similarities may be better for defining distance (which could be for breeding endangered species, etc.) rather than trying to say "what your pet is made of" for ancestry.
      • In other words, even though basepaws indicates they are not a breed test, I worry that those genome-wide distances to breeds described above can cause confusion / misunderstanding for customers.
  • I also learned about some additional mutations that I don't believe are currently on the public Davis VGL website for cats.
    • While I think they are currently disabled, I could learn some information from the Optimal Seletion help menu (available to those with accounts).
    • I think a lot of these come from OMIA (which sounds like OMIM, but I am not aware of an NCBI version of OMIA, unlike OMIM)
  • Saliva sample collected with cytobrush (2x, 15 seconds each)
  • They currently do not provide raw data (as confirmed via e-mail)
    • I also don't believe there is anything about Eastern-Western ancestry (and no raw data for potential re-analysis).  This probably isn't crucial for most customers, but this would mean you would may want to consider UC-Davis and/or basepaws if you were interested in that (or wait and see if that gets added in the future - I did suggest creating a PCA plot like I show above for the basepaws higher coverage WGS data, and I think they are considering that).
  • So, unless you value raw data (such as with the basepaws $950 WGS FASTQ+BAM+VCF) and/or supporting a non-profit (as with the UC-Davis VGL), this is what I would recommend for ~$100
    • That said, I am interested in learning more about cat genetics / genomics.  So, I will still make all 4 purchases, even if I had the option to go back in time and make the decision again.


Overall:

Briefly, I would say I have concerns about the ancestry results and how basepaws represents themselves sometimes.  However, if you want raw data, I think basepaws provides the best option for that (if you may more for higher coverage sequencing).

I personally like supporting a non-profit like UC-Davis, and I think the information that they provide should be used by everybody.

I am not entirely certain what is happening with Optimal Selection / Wisdom Panel.  If you can't purchase that kit, then UC-Davis (and custom re-analysis of raw data) may currently be the only way to check for specific trait mutations in the "Cat Ancestry" test (until basepaws adds those later on).

Finally, since I have been asked by others, I think "Bastu" does mean something (not related to cats), but I was Googling names for cats and that somehow popped up.  I like it because it sounds like "Bast 2" (like Bastet, the Egyptian God) and "Babou" (Salvador Dali's pet Ocelot**, referenced on the TV show Archer).


Footnotes:

*You can report adverse events for veterinary products to the FDA.  However, my understanding is that pre-market approval is not needed before a product is made available.

**To be clear, I am not recommending anybody get an Ocelot as a pet.  I just like Ocelots.

Problem with Earlier Smaller Segments (basepaws):


The issue with the above image is that I would have expected more variation in ancestry between the two copies of chromosomes.

They aren't 100% identical, but it seems odd to me to have matching ancestry / variants at the same position in both chromosome copies (scattered on several chromosomes), particularly for presumably rare events like "Exotic" ancestry estimates (if truly unique for a breed).  For example, you can see some notes on visual inspection and critical assessment of chromosome painting here (and the concept may be easier to see for my human data).

Earlier Percentile Concerns (basepaws):

I think Bastu may also provide a good example of why you may not want to use the percentile rankings in the basepaws results:


When you view the segments, there is more genome-wide predictions with the Maine Coon (and I think that may also be a better match for her M3 long-haired variant and the custom re-analysis that I performed), even though the percentile was lower than the Norwegian Forest Cat.  On the other hand, this may mean others are more likely to have false positives for Maine Coon ancestry segments?

Screenshot for Earlier Interface (Optimal Selection / Wisdom Panel):


There used to be a  "public" list of cats and their results (after you have ordered a kit, I think you could use this link).  For example, you could see what purebred cat reports look like this way.  Likewise, I made Bastu's result public, and you could view that here (completely public, without requiring a sign-in).

I don't currently see this feature.  However, I hope that it is added back in.


Change Log:

12/18/2019 - public post
12/21/2019 - minor updates
12/28/2019 - revise content for clarity
1/8/2020 - add a couple more screenshots; update Bastu's report to include Amplicon-Seq disease variants
1/9/2020 - mention longer turn-around time for UC-Davis VGL; remove holiday prices for basepaws
5/8/2020 - add technical replicate results
7/6/2020 - add link to notes on especially large concerns about Savannah Exotic breed index
8/14/2020 - minor changes + remove earlier note about delay in Amplicon-Seq mutation results
8/29/2020 - add draft for submitted FDA MedWatch report
9/3/2020 - add updated technical replicates and summary
9/7/2020 - add updated technical replicates and summary
9/11/2020 - correct confident technical replicate labels and add basepaws Maine Coon maps
9/15/2020 - add Ocelot note / warning
10/6/2020 - add concern about basepaws "biome testing"
10/7/2020 - minor changes / fix typos
10/16/2020 - add regular WGS report (reorganize post now that I have 3 reports); update/check prices for all 4 options
10/17/2020 - give date instead of time for introduction (since the original post was about a year ago); minor changes + revise content to make more clear (and move points that are currently less relevant below the footnotes).
2/20/2021 - update some basepaws notes, clarifying my opinion and adding examples for metagenomic application
2/21/2021 - minor changes + substantial extra information for dental disease
2/22/2021 - minor changes + additional disease prevalence link
2/26/2021 - add link to acknowledge need to say "consumer"
2/27/2021 - add link to VOHC
3/4/2021 - add link to FDA veterinary adverse event reporting
3/5/2021 - add link with FDA veterinary limits
3/14/2021 - add link to newer blog post
7/19/2021 - update link / posts
4/16/2023 - add link to alternative, independent YouTube assessment; formatting change when describing earlier format for Optimal Selection results.

Thursday, December 5, 2019

PRS Results from my Genomics Data (mostly from impute.me)

I haven't had a whole lot of personal experience with Polygenic Risk Score (PRS) estimates, so I thought it was interesting when I found a couple options for re-analysis of my own genomics data (for selected examples):

Association SNP chip
(impute.me)

(Folkersen et al. 2020)
Other
Re-Analysis Options
23andMe Results
Type 2 Diabetes
(No)
(Type 2 Diabetes, 146 variants)

Average / Above Average
(23andMe-V3, 12/19)

Average / Above Average
(AncestryDNA, 12/19)
MySeq

1.000 risk ratio [error]
(Nebula lcWGS)

0.955 risk ratio
(Genos Exome, 3 variants)

1.089 risk ratio
(Veritas WGS, 6 variants)
"Typical Risk" of 23% (directly from 23andMe, PRS with 1,244 loci)
[actually, slightly lower than normal]

Reduces to less than 1% when age, height, weight, fast food consumption, and exercise rate are taken into consideration (also from 23andMe)
Ulcerative Colitis
(once, so I think really "no")
(23 variants, and 116 variants)

Both Below Average and Above Average Risk, for different PRS
(23andMe-V3, 12/19)

Both Below Average and Above Average Risk, for different PRS
(AncestryDNA, 12/19)
Anxiety Disorder
(Yes, but getting better)
(6 variants)

Average / Above Average
(23andMe-V3, 12/19)

Average / Above Average
(AncestryDNA, 12/19)
Migraine
(Periodic)
(26 variants, and 21 variants)

2 PRS (Average and Above Average)
(23andMe-V3, 12/19)

2 PRS (Average and Above Average)
(AncestryDNA, 12/19)
Eye Color
(Light Brown)
DNA.land

Likely to have Brown Eyes
(23andMe-V3, 12/19)

Likely to have Brown Eyes
(23andMe-V3_V5, 12/19)

Likely to have Brown Eyes
(AncestryDNA, 12/19)
23andMe reports that I am expected to have "brown or hazel eyes" based upon 1 SNP (rs12913832)
Hair Color
(Light Brown)
See Below

(Roughly 25% Red and 50% Blonde)
For "Light or Dark Hair", 23andMe reports that I have "Likely Dark" Hair (using 42 SNPs)

For "Red Hair" 23andMe reports that I am "Unlikely to have red hair" (using 3 MC1R SNPs: rs1805007, rs1805008, and another custom MCR1 probe)
Height
(180 cm)
See Below DNA.land

171 cm: "Likely Taller than Average"
(23andMe-V3, 12/19)

171 cm: "Likely Taller than Average"
(23andMe-V3_V5, 12/19)

171 cm: "Likely Taller than Average"
(AncestryDNA, 12/19)

Individual SNP risks were reported (from impute.me).  While I had a bit of a hard time finding the precise overall risk estimate (without trying to sum / multiply separate risks), this might be OK in terms of getting a sense of whether I was an outlier or not.  For example, being above or below average for "Type 2 Diabetes" seemed to vary (unless you say most people were under something like a null distribution for "average" risk).  In other words, I thought the following plots (which you could see for various traits) were interesting:

impute.me Type 2 Diabetes PRS (23andMe V3)


impute.me Ulcerative Colitis (1st entry23andMe V3)


impute.me Ulcerative Colitis (2nd entry23andMe V3)

impute.me Anxiety Disorder PRS (23andMe V3)

impute.me Migraine-Broad PRS (23andMe V3)


impute.me Migraine PRS (23andMe V3)

impute.me Hair Color (23andMe V3 + Ancestry DNA, respectively)


impute.me Height (23andMe V3)


I thought the anxiety disorder result was interesting for 2 reasons.  First, I have had issues with anxiety problems (for example, you can click here for notes, even though they are primarily related to PatientsLikeMe).  Second, notice the environmental component is larger than the genetics component.  This matches my concerns that I expressed in this review of "blueprint".  For example, I would say the predictive power from birth has some notable limitations (such as difficulties in the need to take medication at any given point in your life).

While I am not sure if the exact right term was used (since I thought "Ulcerative Colitis" was a condition, rather than a symptom).  However, I was hospitalized for Ulcerative Colitis (even though that was a one time occurrence caused from E. coli with Shiga toxin).

I also get migraines.

I don't have Type 2 Diabetes, but I provided that because I also had other PRS results to compare.  Similarly, if others have suggestions where I can quickly compare to the impute.me PRS results, please let me know and I would be very happy to add them!

For example, I did add DNA.land (and 23andMe) Eye Color and Height based upon a Twitter response.  While I think height is one of the more heritable traits, DNA.land couldn't guess my actual height within a few inches (and there is a noticeable spread of points for the impute.me plot above).  Even though DNA.land gave lower confidence to other predictions, I would say these have been "fair" rather than "high" confidence (and everything else probably should have been "low" confidence).  I am close to the diagonal for the impute.me plot, but I don't know if the scale is 1:1.  For example, my DNA.land height prediction was off by 3-4 inches.  However, to be fair, note that the highest and lowest percentiles for high don't have overlap (there are not any points in the upper-left or bottom-right regions of the scatter plot, even though those make up a smaller fraction of the population).

For comparison, here is the distribution of score for DNA.land (where my true height was greater than anything on the density distribution - perhaps because this was height scaled for female percentiles?):


For impute.me, the predicted hair color shows blondness on the x-axis and redness on the y-axis.  The cyan circle is my actual color (which I filled in), and the while circle is my predicted color.  I think my hair color used to be lighter than it is now (and I think the shade that I reported for myself was a bit too dark), so that is closer to the genetic prediction (perhaps half-way between).

It may be worth noting that 23andMe could predict that I had brown hair and eyes (although I think that covers most people and you need the more rare traits to better calculate accuracy - for example, Francis Collins said that his 23andMe report indicated he had brown eyes when he really had blue eyes, at least 10 years ago).

Again, for comparison, here is the distribution of DNA.land scores for eye color:


I didn't add the AncestryDNA density plots since they looked qualitatively similar to the 23andMe V3 plots (and, on another computer, I had an issue with the percent variance explained appearing in a pie chart that was harder to read).  I also originally intended to test my updated 23andMe genotypes (V3+V5), but I got an error saying that data was already uploaded (from my V3 chip).  However, perhaps I can test those results later, and see if they are still similar.

With a $5 donation, the turn-around time for processing was 1-3 days.

For Genos Exome and Veritas WGS data, I used the BWA-MEM Re-Aligned GATK Variant calls.  However, I think the main conclusion from looking at my diabetes results was that I was of average risk, and I don't believe my own genetic diabetes PRS risk assessment was great without taking additional factors into consideration (for 23andMe, that was a difference between 23% and 1%, after considering BMI, diet, and exercise).

This essentially matches Supplementary Figure S12 for this paper (whose title I respectfully believe can give the reader the wrong impression, and there is at least one objective error that I believe needs to be corrected), where absolute risk explained was usually very low (usually explaining less than 15% of the variation for a trait).  You can also see that the variability explained by "this score" for the impute.me PRS above is estimated to be less than half of the genetic component.

I think the preprint by Brockman et al. 2021 might also have some additional relevant information for this discussion.

In somewhat different contexts, you can also see some notes / concerns about percentiles / indices in the posts on Nebula and basepaws lcWGS results.

Change Log:

12/5/2019 - public post
12/7/2019 - add DNA.land results based upon Twitter reply from Debbie Kennett; revise wording in post
12/8/2019 - mention possible scaling for female height; also fix date for previous log entry.
6/25/2020 - add links to posts with Nebula and basepaws results.  Minor formatting changes.
7/7/2020 - add reference to impute.me paper
4/22/2021 - add reference to another paper
2/4/2024 - change column labels to be more precise

Wednesday, December 4, 2019

Experiences with On-Line Courses

I converted some notes from my Google Sites page to a blog post, in order to make things a little more clear and neat:

So far, I've tested a couple options for on-line courses:

Udemy (2 courses):

  • The first course that I completed was The Complete Ubuntu Linux Server Administration Course !
    • I thought the course that I took was a good overview of concepts / commands to use for data analysis on a personal server (or on a VM at work)
      • For example, at least currently, I thought this was a little better for learning how to set up an Ubuntu server for personal use (versus being a system admin in an enterprise system)
    • However, I am not saying this is sufficient for me to be an system admin for others.  That would require additional experience and probably some evidence that you make mistakes beyond some maximal acceptable level (certification is essentially an honor system, but I think that is OK as long as that is made clear)
    • I think there is usually some sort of discount - I paid $10.99, which I think is very reasonable (making up for typos and possibly slightly outdated information).
      • However, I am sorry, but I would not recommend the course at regular price.
      • Cost is for lifetime access - you don't need to pay a monthly fee to access contents from courses that you have taken
    • So, when a discount is offered again, I may try another Linux / UNIX course.
  • The second course that I completed was Learning FileMaker 18 - Complete Course
    • This provides a lot of good videos to watch (with lifetime access)
    • I purchased at full price, and I think that was OK.
    • However, again, I am not saying this is sufficient for me to be an intermediate or advanced FileMaker developer.
    • No quizzes or assignments, but I thought it was good to follow-up after some shorter LinkedIn Learning courses (such as Learning FileMaker 16 and FileMaker: Relational Database Design)
  • In both cases, you can add bookmarks to tag specific points in the lecture.

Lynda / LinkedIn Learning (multiple courses):

  • So far, all of the courses that I have completed (including Learning Bash ScriptingBuilding an Ubuntu Home Server, and Learning Ubuntu Server) were each shorter than the Udemy course on Linux administration (an estimated time of 1-3 hours)
    • Kind of like the Coursera classes, I currently already use UNIX commands (for bash scripting).  However, there are probably some extra skills that I can learn.
    • The Ubuntu server course is more like what I took from Udemy (some personal experience, but a larger fraction of material that I don't use on a regular basis)
  • Unlike the our sites, I also took some classes on social interaction (Developing Your Emotional IntelligenceGiving and Receiving FeedbackUnconscious BiasHaving Difficult Conversations, and Communicating with Diplomacy and Tact)
  • Similar to Udemy, there is no time limit to complete the courses
  • You can download exercise files, but you will get the certificate if you watch all of the material
    • For example, my bash class was set as complete before I finished the final quiz
    • Likewise, there were no quizzes or exercises for the "building" Ubuntu home server class (although see quizzes in Learning Ubuntu Server)
    • So, similar to Udemy, I would say this is for personal growth and shouldn't really count as certification for a current or future job
  • For LinkedIn Learning, there is a 1-month free trial, and then $29.99/month (monthly) or $19.99/month (for full year)
    • There is a "Notebook" to manually take notes (once you press enter, it logs the time of the video - so, don't wait to take notes after the presentation)
    • There is also an F.A.Q. section to ask questions, etc.
    • However, you can take as many classes as you like each month (without extra charges)
  • Also, I heard Lynda may be offered for free from some libraries.  For example, here are free courses offered through the LA County library system.  I think that is also I hope this is still true from LinkedIn Learning.  That may make the difference between me preferring Lynda versus Udemy.
    • To be fair, I did pay for the Premium version of the Duolingo app on my phone (which is listed on my local library's website), but my concern about posting the "certificate" on LinkedIn is still valid (and I think Duolingo was $10/month as well as being more interactive than most of the Lynda classes that I have checked out, in addition to having a freely available version).


Coursera (2 individual courses, 2 specializations completed):

  • From what I have tested, the Coursera courses seem to have more structure / requirements than a Udemy course
    • If you want to provide these certifications to employers, then I think this is is important - philosophically, I think you would be treating your work at a real job like a commitment to complete a Coursera course
    • For example, if you didn't have previous experience, I think it is important to take the courses in order and/or check if there are dependencies for previous skills (such as general coding in R, etc.)
    • That said, if you didn't want to learn, you can probably find a way to pass the course through either brute force and/or getting answers from others.  So, it is not perfect, but I think this is reasonable security for the price (and I really did learn some new material from the courses).
      • If this is for certification to keep an existing job, an additional rule to have to share your project with your supervisor (in addition to passing peer review) may also help make cheating harder?
  • As a technical note for all courses that I have seen, I find the feature to take notes / bookmarks in lecture videos to be useful.
  • Also, if you are worried about over-committing yourself, I don't know all of the rules, but there is some publicly available content to try and avoid starting  a course that you can't handle.
    • For the Regression Models course that I took, there was code here, videos here, and reading material here.
      • I think this is my favorite course that I have taken so far, and I would recommend it to others.
      • The course was estimated to take 17 hours, and it took me ~24 hours.  Assuming that people with less experience will complete the course less quickly, I think that is at least a 30% underestimate of time.
        • However, if you assumed that you were supposed to spend 8 hours a week for 4 weeks, then this was less than 32 hours (so, perhaps expected time should have been provided as an interval).
      • If I had the ability to rate at the 0.5 star level, I would have given it 4.5 stars (my actual rating was 5 stars)
    • For the Practical Machine Learning course, I think the public materials are a little different, but I did learn about RWeka in the caret package (when I was previously only familiar with the Weka GUI) and this tutorial was linked in the slides.
      • This course has noticeably more bugs in the quizzes than the "Regression Models" class (and it also lacked any swirl practice exercises, which I thought were nice).  You can re-take quizzes and I did like learning about the caret package.  However, I am currently less confident about recommending this course.
      • Interestingly, more than one of issues with the quizzes essentially revealed a limitation / problem with a strategy described in the videos, which might even be a somewhat popular method.  However, explicitly describing limitations / problems in the lectures (and the scientific literature) is a better way to find out about this (even if this causes a hopefully minor level of conflict with other researchers, or even your own earlier publication record), and errors / bugs should respectfully be acknowledged and fixed as soon as possible.  However, I think this is mostly due to changes in the dependencies over time - if the conclusions are likely to change, then that matters (but I think that may have to a general limitation in precision, which users need to be cautious about).
      • While the course primarily uses the caret package, there was at least one task that required the elasticnet R package for LASSO regression.
      • For the project, I think you should take a look at this forum discussion, in terms of posting a compiled HTML page the way that is requested.
      • This course was estimated to take 14 hours to complete.  While I didn't record all of my time as carefully, I would say that spent at least 17-19 hours to complete the course.  While this doesn't seem as bad (at least a 20% underestimate of time), I am reducing the overall rating below since I thought the extra time for exercises helped with understanding.
      • If I had the ability to rate at the 0.5 star level, I would have given it 3.5 stars (but I may have rated it higher closer to the time the course was developed, and I my actual rating was 4 stars)
      • To be fair, I thought the results of the course project were interesting, so I want to clear that I did find the course to be useful.
        • I decided it was probably more tactful to not link to the submission, but I believe there was at least 3 other projects that were able to achieve better accuracy on the quiz.
        • I also thought we were supposed to limit ourselves to 4 types of measurements (but this might have just been my misunderstanding).  For example, I filtered "num_window" before doing any analysis, and I am not sure if that mattered.
        • However, my point is that I agree/believe that a better model can be created (but the need to be cautious about over-estimating accuracy is a real concern for a lot of projects).
    • The 2 individual Johns Hopkins data science courses that I listed above are also part of certificates (for 5 courses or 10 courses) - at $49 per month and an estimated time to completion of 6-8 months, I believe that should be a total cost of less than $500.
  • UCSD Bioinformatics Specialization: Finding Hidden Messages in DNA (Course 1, dropped out before being charged).
    • Even though the names of the classes seemed like a good fit, my experience from the 1st class and looking at the syllabus for the 2nd class made me decide this is not a good fit for what I was looking into in that I think the emphasis on more advanced coding or coding efficiency was more than needed for my current position (courses to introduce others to genomics and/or beginner coding, or provide intermediate level bioinformatics certification for myself).
      • For example, I found the course to be harder than I was expecting, even though I write or modify code (in R/Python/Perl) for my regular job.
    • I thought it was interesting that the basic requirements didn't require coding, but there was an "honors" track allowed practice for testing applications with coding.  However, if you plan to meet the honors requirement, I would recommend taking at least 1 Python core in advance.  I needed to be proficient in coding in order to complete the first few coding exercises.
      • Some of the information needed to pass the quiz is only in the Stepik section.
      • If you don't actually complete all of the tasks for the past week, I think passing the next week becomes harder (even if you decided that you didn't need to get the honors designation).
      • So, even if I could have passed the course with the time allotted, I had other things that I needed to complete and I decided to continue this search (for courses to recommend to beginners or get intermediate-level certification while working a full time job) over completing this particular class.
    • I learned about the Biology Meets Programming: Bioinformatics for Beginners course to learn Python (although I have not current taken a look at that, since I already use Python on a fairly regular basis)
    • I learned about the Ori-Finder program
    • I learned that courses are also available from Stepik, and you can see my profile here (currently, for content linked to the Coursera course).
    • I also found some of the optional calculations (which don't contribute points) required looking at the comments in order for me to be able to figure out the answer.
      • There are also not explanations for the specific answers if you get the question wrong.  For example, that can make it hard to find and confirm if there is a bug in my code, since there are functions worked for the Stepik exercise and certain versions of the quiz, but are I can get scored as having the wrong answer for some versions of the questions.
  • I completed Epidemiology in Public Health Practice specialization from Johns Hopkins University.  This includes the following individual courses:
    • Essential Epidemiologic Tools for Public Health Practice
      • I thought the IHME plots were interesting, including projections for COVID-19
      • I learned about the open-source QGIS software
      • I learned about how Shapefiles can be downloaded for analysis of data displayed along geographical regions (along with US Census data to overlay)
      • I think the time-estimates were reasonable
    • Data and Health Indicators in Public Health Practice
      • Learned about Quality of Mortality Statistics (including sources like the PAHO/WHO and WHO)
      • Learned about the ill-defined cause of death measure/rate (as a quality metric to compare sources), and Quality of Mortality Index Score that was defined as 0.7 * percent under-registered deaths + 0.3 * percent ill-defined cause of death (ideally, less than 10%)
      • Consideration of artifacts (such as changes in the reporting systems affecting the rate estimates) was also discussed
      • Discussed common adjustments to rates in public health applications
      • I liked the use of partially completed Excel files to help provide practice with relevant calculations
      • I kept re-taking the quiz (to learn the right answers), but I had more difficulty getting >80% on my first try for this course (compared to the previous course)
      • I think there were also relatively more typos than the previous course (for example, a table is missing for one of the questions on the last quiz)
      • I think the required time estimate may be under-estimated (perhaps 5 hours should be the lower value for a time interval)
    • Surveillance Systems: The Building Blocks
      • I think the time-estimates were reasonable
      • I was more likely to pass the quizzes on the first try, but I usually went back to increase re-take the quiz and increase my score
    • Surveillance Systems: Analysis, Dissemination, and Special Systems
      • I think the time-estimates were reasonable
      • I think that I was able to pass all of the quizzes on the first try, but I usually went back to increase re-take the quiz and increase my score
    • Outbreaks and Epidemics
      • Explained the Basic Reproductive Number (R0, infections without immunity) and Reproductive Number (R, infections where a certain percent of the population already has immunity, may be estimated as R0* percent susceptible)
      • There were optional exercises throughout the lectures, but answers were often not provided
        • I thought this as an interesting simulation for the scientific process (when the true answer may not be known), and I thought the exercises helped with understanding of the material
        • These could have been used as the quiz questions, but that probably would have decreased the chances of being able to pass on the 1st try.  This would bother me less than having difficulty passing due to typos and/or wrong "correct" answers, but I can see how some other students might view this negatively.
        • Completing the exercises takes extra time, but I think this was still OK
  • I have completed the Genomic Data Science specialization from Johns Hopkins University.  This includes the following individual courses:
    • Introduction to Genomic Technologies
      • The first week of the first class made me think this is probably a better fit for beginners than the UCSD Bioinformatics specialization.  For example, I could get 100% on the 1st quiz on my 1st try.
      • No coding is required for this course
      • I think there might be a benefit to requiring anybody who wants to do a genomics experiment to be able to pass a course like this (offered from an objective 3rd party).
    • Genomic Data Science with Galaxy
      • In general, I think Galaxy is a good intermediate step for becoming familiar with open-source genomics programs.
      • However, the local (or cloud) installation of galaxy was something new for me.
      • While not directly part of the course, I found that I needed to learn how to manage python packages in a virtual environment to troubleshoot local installation of galaxy on a VirtualBox VM (to try and troubleshoot an issue with importing "ensure_str" from the "six" package.  For example, you might find the section "Activating a virtual environment" of this tutorial to be useful (except that I used /path/to/galaxy/.venv/bin/activate, instead of env/bin/activate).
        • Strictly speaking, I have not yet solved this problem, but I tried to see what I could do for the course if I don't install Galaxy locally or use AWS.
        • The course project uses a relatively small set of reads (less than 100,000 paired-end reads per sample), so that should help with being able to use the main (free) Galaxy interface.
      • Similar to my own experiences (where I decided to buy / build a local server install of using AWS), there is a warning in the Week4 discussion that you don't need to use AWS to complete the course and one student was charged $1700 to try and complete the course project.  This is why I was focusing more on the local installation, even though AWS is popular and it was probably a good idea to get exposure to how Galaxy could work on AWS.
      • Even if you don't take the course, you might find the Galaxy Training! website useful as an introduction to various types of analysis and using Galaxy.
        • However, you might need to be careful that you have all of the necessary dependencies on your version of Galaxy for a pre-existing workflow.
    • Python for Genomic Data Science
      • The first week describes Python through the interactive interface for basic concepts (while then showing how to combine those commands into a script).  I think this is good for beginners, such as biologists that want to learn to code.
      • Learned about Python resources that can be passed along, such as LearnPython.org
      • While I could pass (with >70%) on my first try, I thought the wording for the 2nd quiz added some unnecessary complications (kind of like SAT or GRE questions can be intentionally misleading).  I think this adds frustration for true beginners (who may understand the content better than they think the quiz reflects), even if you are allowed to re-take the quiz.
      • If it hadn't been formatting issues for a question in Quiz 4 (in Week 2), I would have been able to get through Week 2 without writing any "long" scripts outside of the interactive interface (for a more complicated, multi-step process).
      • If you are using this for learning (rather than certification), then maybe it is worth mentioning that a lot of students thought the quizzes in week 2 were too difficult (without enough preparation from the lectures).
      • For the most part, you can get through Week3 with either writing no scripts or only short scripts (possibly with 1 exception, requiring the use of the clock function).
      • In general, you might find this tutorial helpful for using Biopython
      • You can also see a summary for the BLAST analysis here.  The run-time makes me question whether this is the optimal way to run BLAST (in other situations), but I think changing the parameters for NCBIWWW.qblast() to use expect=1 * 10**(-20), alignments=3 might help some.
      • The final example require that you are able to write more complicated scripts.
    • Algorithms for DNA Sequencing
      • I think this is essentially the second part of the Python class (covering more intermediate-to-advanced skills), along with discussion more about the details of DNA sequencing.
      • Includes link to try Try Jupyter using for Python analysis
      • There are some externally available materials in ads1-slides and ads1-notebooks, which I believe cover all 4 weeks.
      • While I think it should be OK for certification, I wonder if this might be a bit much for a true beginner (without some details like modules and objects not really explained on the programming side in the lectures).
        • I think you should also plan for 4~7 hours a week, rather than the 2-4 hours suggested)
        • That said, I thought Week 2 had the most difficult questions for me.  If this is true for others, then you should not assume the difficulty will continually increase.
      • Helped me better understand the concept of a De Bruijn graph (which I mostly remembered because of difficulty with pronunciation, but the instructor pronounced it the same in his lectures as in this other video, which I would describe as sounding as if you did not pronounce the "j").
      • I thought that there was fewer typos and less inaccurate information than I encountered in other Coursera courses, so I thought that was great.
    • Command Line Tools for Genomic Data Science
      • A CentOS VirtualBox environment is provided for the course
      • The course covers some basic unix commands, general genomics tools / resources (samtools, bedtools, IGV, NCBI, UCSC Table Browser, etc.), tools for DNA-Seq alignment and variant calling, and tools for RNA-Seq gene expression analysis
      • In Week 3, I learned about being able to use zcat to view compressed files without decompressing them.
      • I learned that you can use grep -v to exclude certain lines (such as headers with "#")
      • I also learned that you can use grep -P to search expressions with tabs (using Perl regular expressions).
      • I also gained experience learning how to interpret the cuffcompare output.
      • A lot of students (including myself) got a very low score on the first attempt the first Exam 4 because the example code provides the GTF to you need to not provide the GTF (at the TopHat2 alignment step) in order to get the right answers.
        • For me, that made the difference between getting <10% versus >95% on Exam 4
    • Bioconductor for Genomic Data Science
      • I believe the class was designed with packages from R-3.2.1
      • I believe that you can view many of the videos here.
      • While only a subset of the content relates to this course, there are some code examples here.
      • While it might be good for intermediate-to-advanced users, this course took me noticeably more time per week than the last course.  So, I am not sure if that might be a bit much for beginners.
      • I learned some new things about basic R structures (such as a limit on the size of a vector, the integer versus numeric type, etc.).  So, this was useful to someone who already has experience, but the instructor recommended having some experience using R before taking the course.
      • I learned about the plotRanges() function (for IRanges objects).
      • While not related to this course, you can also see some examples of those plots within this tutorial.
      • I learned about AnnotationHub search functions (including the display() function for interactive browsing).
      • Quiz 1 had a tip that was not precisely correct, and I think that caused some confusion for some students.
      • I believe that I have had more answers that were wrong (without an explanation) than any previous courses.  Sometimes, I received credit for my guesses (closest to but not exactly matching any of the options).  While this might not cause you to fail the course (and I got 100% for Quiz 2, even though I my answer was noticeably different than the 4 provided options for 3/10 questions), it might be worth knowing about in advance.
    • Statistics for Genomic Data Science
      • There are public links for the course materials here, along with an R package here.
      • For the GitHub code provided in the introduction (linked above), I was a little confused why "biocLite("jtleek/genstats",ref="gh-pages")" instead of "devtools::install_github("jtleek/genstats")", and I admittedly got an error message with both strategies using R-3.4.1 on 12/26/2020 (even though the exact error messages were a little different).
      • Nevertheless, the first link has the R code from the lectures, which I think is what is most important.
      • I tend to prefer using regular R over Rstudio.  However, you can still complete the R Markdown tasks with rmarkdown::render('Question2.Rmd', 'pdf_document') (using the rmarkdown package installed with install.packages("rmarkdown") and loaded with library(rmarkdown), as described here and here).  This might require installing dependencies like pandoc, but I found I could get that working for the second question on Quiz 1 by running R within "Bash on Ubuntu" on Windows 10 (with R version 3.2.3).
      • I wish the statistics were easier to find, but I saw a pop-up saying that the average time to complete Week 1 was 6 hours.  This is noticeably longer than the 3 hours listed in the syllabus, but I think that could be true (especially if you have issues with compatibility with the current version of R and packages and what was used in the course, I believe in 2015).
      • I also needed to read forum discussions like this one (or this one) to realize that an additional line was needed to run the code for the quiz (as well as using R version 3.2.3 in Ubuntu, since I think the dependency commands also changed over time).
      • I needed to use a different version of R in Question 6 of Week 1 (relative to the earlier questions).
      • I learned about the cutree function in R , which can be tested as an alternative to kmeans.
      • I learned that there is an R-base lm.fit function to carry out linear regression for several comparisons faster than lm (in addition to other implementations like fastLmPure in the RcppArmadillo package, a manual calculation in C++ using Rcpp and the boost libraries in the BH package, etc.).
      • For logistic regression and generalized linear models, this link was provided as a class resource for more information.
      • I learned the genefilter package has rowttests and rowFtests implementations for carrying out several comparisons on a matrix (and is easier to use than implementing your own Rcpp calculation).
      • I learned that I can use the snp.rhs.tests function in the snpStats package to relatively quickly apply logistic regression with a table of SNPs.  I also learned how to use the slotNames() and chi.squared() functions to work with the resulting object.
      • There were concerns about incomplete or imprecise information in forum (including quiz questions that did not have an answer).  If you are looking for certification of what you can currently do, perhaps this is OK.  However, if you are trying to learn the material for the first time, then this might be worth keeping in mind.
      • It was initially misunderstanding on my part, but I think this discussion may be worth taking into consideration (where removing genes with average counts less than 100 before running any statistical test increased the correlation of test statistics and defined a less extremely large number of differentially expressed genes).
    • Genomic Data Science Capstone
      • This is spread out among 10 weeks (rather than 4 weeks, like the other courses).
      • More specially, I think the course is designed as if it was for 8 weeks of work, but extra time is allowed for the first 2 "short" weeks (in order to help provided extra time to get through the alignment step in the 4th week, with the 1st task / quiz in the 3rd week).
      • Within 1 month of finishing the 7th "regular" course, I received an e-mail with a subject of "Unsubscribed after specialization completion" and a message that begins with "Congratulations! You earned your certificate".  However, I did not actually receive a certificate at that time, and I had not yet completed the Capstone.
      • Instead, the goal was to not charge me for the Capstone in the same way that I was charged when I was working on the other courses.
      • Access to the Capstone was extended when I tried to follow up on the message.  So, please note that there is a time limit to complete the Capstone after completing the 7th class, and there are still deadlines for each session of the Capstone (after enrolling on 1/24/2021, there were deadlines from 2/14/2021 until 4/7/2021 for me).
      • I thought the instructions were confusing for Week 5 and Week 9
      • I don't think others shared the same confusion for Week 9, but I think there were some difficulties expressed for Week 5.
      • I thought the instructions for Week 6 were OK, but most of the peer reports that I graded did not in fact upload a table with samples in columns and genes in rows.  So, I think something was in fact confusing to those new to the field.
      • I don't think the full documentation could be provided within 5 pages for Week 10, but I hosted my code and reports on GitHub
  • I think I already have a fair amount on my "To-Do" list, but I am also interested in checking out if Biostatistics in Public Health Specialization from Johns Hopkins University
  • Coursera lists the cost at $29-$99, either at the course or month level.
    • The JHU Data Science courses were $49 per month (but that counted for both the Regression Models and Practical Machine Learning courses)
    • The JHU Genomic Data Science courses were $39 per month
    • I wouldn't recommend taking more than 1 course at a time (with a full time job).

edX (1 certificate in progress):


  • I currently don't have experience with courses through this medium, but there are additional on-line courses / certifications / degrees listed here that aren't on Coursera
  • For example, I believe some of the courses for the Georgia Tech on-line data science program are listed here.
    • While I don't have direct experience, this student's GitHub content makes me think CSE 6040x (a core course in the data science curriculum) may cover some similar content as I have taken on Coursera.
    • You can also see some other courses / degrees from GTx here, which includes a MicroMasters in Analytics.
    • As I mention below, I think the on-campus MS in Bioinformatics may be a better fit than the MS in Analytics, for myself or somebody else with a similar background.
  • The University of Maryland, Global Campus has a MicroMasters Bioinformatics on edX
    • My understanding is that you can also get partial credit for the coursework (for BIOT 640, BIOT 630, BIFS 614 and BIFS 619) if you complete the MicroMasters for the Biotechnology : Bioinformatics on-line degree.
      • If I understand things correctly, this might also help with the cost difference for being out of state (~$17,000 in-state, ~$24,000 out-of-state).  However, these also seem like arguably the most important courses in the program, with the information that is most likely to be used in everybody research.
      • However, I also believe this is no longer going to be offered, after 2020
    • I don't have direct experience with this either.  However, this seems like something that could theoretically be appropriate for somebody like myself.
  • I am not sure if it is best fit for me, there are also other related MicroMasters program like Data Science from UCSD and Statistics and Data Science from MIT.
    • I believe these are all <$2,000
    • If I look at the MIT Data Analysis class, the MicroMasters link is only for the final exam (14.310Fx) whereas the course itself (14.310x) has a different timeline and registration.
    • There is also a "professional certificate" in Data Science from Harvard, which costs less and has less of a time commitment.
  • The Coursera Statistics for Genomic Data Science course references the edX Statistical Inference and Modeling for High-Throughput Experiments course for additional information (yes - I really mean the Coursera course recommended the edX course).
    • That page references professional certificates from Harvard (with a UNC - Chapel Hill co-instructor) in Data Analysis for Life Sciences and Data Analysis for Genomics
    • My understanding is that the pacing rules should be similar across courses (each course has deadlines, and the courses must all be completed within 24 months of the purchase date).
    • So, I am not completely what I could have done for free, but I did purchase the professional certificate material for Data Analysis for Life Sciences (I think theoretically completable in 4 months).
      • I am not sure of all of the implications, but I have been notified of a conversion to a for-profit model starting 11/16/2021If this causes some sort of fundamental change, then I may be much less hesitant to recommend edX to others.
      • With or without taking all of the courses, I think this HTML document may be a helpful reference.
      • Likewise, I think this GitHub page is worth knowing about.
      • While possibly confusing, this eBook is also free.  However, a free donation is suggested.  I think this may be a good strategy for providing materials (including R packages), and I would make a donation if I had not already paid for the edX course.
      • Statistics and R (grade of 93%)
        • Introduction says "All of the material is available immediately, and the only deadline is the end of the course".
        • However, each week has homework and quiz deadlines.
        • My understanding is that you can't get an extension if you haven't completed all of the work before the final deadline.
        • Discussion group participation is not supported (for questions about the concepts in the material).
          • For example, for the first question, I am asked to enter the version of R.
          • However, this course was developed a while ago.  So, tried to enter my version as 4.0.3, and I got an error message (which was true at the time, but it is no longer true).
          • I will report that through the formal method provided.  However, I thought having the discussion groups helped with identifying problems in Coursera.  Unfortunately, a number of them were not corrected, but having feedback from others was helpful (and sometimes there was a official moderator that could acknowledge the problem, even if the instructor was no longer directly providing support for the class and/or correcting errors).
            • As follow-up, I think issues of things that need to be changed in the course material is OK.  However, problems with the interface should be reported to edX, and questions about the concepts should be asked on public forums (to be answered by others).
          • So, edX can provide this functionality, but the communication about asking questions references support outside of the course (StackOverflow, etc.).  This list overlooked Biostars, and there was some other misunderstanding on my part.  However, I will check out all 4 courses, and provide an overall assessment / recommendation (even if I don't like this particular decision).
          • Different versions of R affect functionality.  So, in this case, I also had R 3.6.3 (or, generally, 3.x.x), and I went back to use that (instead of the version of RStudio that I had installed.
        • I have used Swirl for at least 1 Coursera course before (with material specifically designed for that course).  However, I found it useful to learn that there are basic R tutorials already build into the base Swirl package.
        • One of the early exercise questions asks you to use a for loop, without having previously described how to do that.  If you are like me, then the course may be OK for professional certification.  However, if you are just starting R, I am not sure if is the best way to learn R (and the instructor did acknowledge that learning the basics of R can take time).
        • For the 2nd set of exercises, the part about "To create a vector with the numbers 3 to 7...," is more relevant for Question 6 than Question 5.  I found this confusing, but I eventually figured it out.
        • I don't plan to use it, but I did learn an explanation for something that I have noticed for a while
          • You can use "<-" or "=" to assign values to variables
          • I started using "<-" because that was in training materials
          • However, when I learned that I could do the same thing with just "=," I started saving characters (by using 1 that was easy to remember, instead of 2).
          • However, I have now seen an example where the function can be different, and there was the explanation that this was used for piping.
          • In other words, the following example was used to combine 3 lines of code to define the values for the variable "controls":
            • controls1 <- filter(dat, Diet=="chow") %>% select(Bodyweight) %>% unlist
          • I find this harder to read (instead of easier to read), so I would rather write out the 3 lines.  However, I did learn something new.
          • That said, the following also works: controls2 = filter(dat, Diet=="chow") %>% select(Bodyweight) %>% unlist
          • That said, in later exercises, it seems like I might need to import the dplyr package in order to use that piping function (at least with the other functions).
          • I learned about the Median Absolute Deviation (MAD), so that the median and MAD can be used as an alternative to mean and standard deviation SD for a collection of samples with outliers.  This can be calculated with the mad() function in R.
        • I learned about the ecdf() function
        • I am not sure how often I will use it, but I learned about the split() function (in the context of creating the input for an alternate way to use the boxplot() function)
        • The order of the boxplot exercises gives a clue, but I think using some extra words in the 3rd exercise to explain that the topic has returned to the data from the 1st exercise would be helpful (and explicitly saying that analysis of data from the 2nd exercise may help).  Again, helps me learn more, but this makes me question if this is the best course for a complete beginner.
        • I think the background for Week 2 was relatively better (perhaps more complete information for a beginner).  However, it did take me a little while to figure out what was being asked for Exercise 2 in the "CLT and t-distribution in Practice Exercises" subsection of the timeline, and figure out what I needed to modify for my code.  Sometimes you have 2 chances, and sometimes you have 5 chances to get the answer right.  In this case, I used the logic of what was being asked to figure out the right answer (with only 2 chances), and then I used the provided solution to go back and figure out how to modify my code and understand precisely what the question was asking.
      • Introduction to Linear Models and Matrix Algebra (grade of 100%)
        • I learned about using the solve() function to calculate the inverse matrix in R
        • I learned about the crossprod() function (faster version of t(x) %*% y) and tcrosspod() function (faster version of x %*% t(y)).  This is discussed in the context of using linear algebra to solve for the Residual Sum of Squares (RSS).
        • Standard errors for model coefficients is also described, with content similar to presented here.
        • I think this is the course where we first see lectures from Michael Love.
        • There is a page with content from those lectures here.  For example, I learned about the contrast() function and package from that lecture.
        • I also learned about the glht() function from the multcomp package.
        • While mostly familiar with the concept of confounded variables, I learned about that in the context of collinearity and the "rank" of a model matrix determined using qr().
        • There are some additional materials about QR decomposition and linear models/regression here.
        • I think there is also some additional useful / interesting information linked from the course to here.
        • During an early slide, I believe the limma package was referenced.  I can see how this contents relates to what is being done in limma.  However, I don't believe there were any lectures or exercises describing applications with that package (in this particular course).
      • Statistical Inference and Modeling for High-Throughput Experiments (grade of 96%)
        • This course covers topics like multiple testing (the concept as well as solutions), statistical models (binomial. Poisson, etc.), maximum likelihood estimates, parametric model fitting, Bayes' theorem, etc.
        • This is also the course where application of the limma package for differential expression is discussed, which I believe helps me understand the method better.
      • High-Dimensional Data Analysis (grade of 98%)
        • I learned how to use cmdscale() create an MDS plot (for 2 out of k dimensions) using R-base code, using a distance object such as that created from dist().
        • I am not listing all examples here, but there are a number of uncorrected typos.  Also, there is at least 1 question where you can't receive credit unless you provide answers that are wrong by any interpretation (Question 4 of the Week3 quiz, which is actually the 5th question because the  question numbers start with the 2nd question).
        • I think the course is useful in a number of ways, but I think the errors mentioned above need to be taken into consideration (especially if you are new to the material).
      • You can view my overall certificate here.

While I am not sure how such certification is perceived by others, Coursera has less expensive options.  For example, University of Chicago has a MasterTrack for "Machine Learning for Analytics" (for $4,000).

If I understand everything, then I believe I think an on-line degree in Analytics from Georgia Tech should be a little more than $10,000 ($275 per credit hour + fees).  I should thank the contact of the Data Science on-line Master's Degree from UC Riverside for having me take a second look at that program (even as a current California resident, I think the Georgia Tech program would cost less, but I think the requirements are different).  However, I think the most advanced analysis courses in a Bioinformatics program (and/or the "MicroMasters" on edX that I list above) may be a better fit for me than the on-line Analytics program (at least for Georgia Tech, where I have more direct experience with understanding the difficulty of the on-campus courses, which I thought were supposed to be the same through edX).

For others that are interested, I think the there is a Bioinformatics MS program at Indiana University - Purdue University Indianapolis, which I think is designed for those who may have other responsibilities (it is an on-campus program, even though there are night classes and/or an out-of-state scholarship waiver?).  Under "Plan of Study", you can see the "Course Schedule" for individual classes (where it looks like a lot of classes start at 6 PM).  While an interesting point of discussion, I think this may end up being somewhat costly for me as an individual (as with most out-of-state or private on-campus programs).

As an undergrad, I commuted from home for 3 out of the 4 years (except freshman year, to make friends in the dorm).  So, if you live near your family, it might be a little more embarrassing as an adult, but that could be one way to get an on-campus master degree at a lower total cost.  However, being a public school makes a difference (if you can qualify for in-state tuition).  As I mentioned in this post, I have partially completed coursework from the Bioinformatics MS degrees at Georgia Tech and University of Michigan (which I believe are a good reflection of what sort of courses I can handle).  However, limits on how much transfer credit can affect the time to get the degree may be something to keep in mind for any MS program.  For example, even if I received credit for some required courses, I would still need to take 37 hours of courses after being admitted and enrolling into the Bioinformatics MS program at Georgia Tech.

If there are other suggestions regarding MS degrees in Bioinformatics / Analytics / Data Science that can be earned for less than $20,000 (and/or you have concerns that the true costs may be higher than any of the estimates above), please feel free to comment below.  If I didn't have any previous experience, I think the on-campus degree programs may have an advantage.  However, if I have ~10 years of experience (and essentially the combined equivalent of an MS degree, along with an MA degree from Princeton), then I am not sure if an on-campus degree (or even necessarily an on-line MS degree) is needed for somebody at this stage.  So, I am guessing this might be a relevant price point for others as well.

However, I really do like the idea of on-line courses for continuing education for those that already have full time jobs that they want to keep (with some necessary professional growth).


Change Log:

12/4/2019 - public post (convert draft due to this Biostars discussion)
12/5/2019 - add links to Lynda / LinkedIn Learning communication classes
12/6/2019 - add another Lynda / LinkedIn Learning communication class
12/7/2019 - minor change to reflect that I have taken more than 2 Lynda / LinkedIn Learning communication classes
12/8/2019 - update number of "Practical Machine Learning" courses with higher accuracy as well as add one more link to a Lynda / LinkedIn Learning class
12/9/2019 - add one more link to a Lynda / LinkedIn Learning class for communication
12/10/2019 - add benefit for no limit to source of classes for Lynda / LinkedIn Learning
4/23/2020 - add links to edX (without primary experience)
4/24/2020 - update information about GT Bioinformatics MS
4/26/2020 - add additional links; re-arrange some information
4/29/2020 - note that I have started to take some epidemiology courses
5/1/2020 - add epidemiology notes
5/3/2020 - add epidemiology notes
5/6/2020 - add epidemiology notes
5/7/2020 - add epidemiology notes
5/8/2020 - add epidemiology notes + start UCSD Bioinformatics notes
5/11/2020 - minor change + add UCSD Bioinformatics notes
5/12/2020 - add UCSD Bioinformatics notes
5/13/2020 - add UCSD Bioinformatics notes (date may not be exactly correct?)
5/17/2020 - add UCSD Bioinformatics notes
5/19/2020 - add JHU Genomic Data Science notes
5/22/2020 - add JHU Genomic Data Science notes
5/24/2020 - add JHU Genomic Data Science notes
5/28/2020 - add JHU Genomic Data Science notes
5/29/2020 - add UMGC MicroMasters notes (even though it is being discontinued)
6/11/2020 - add JHU Genomic Data Science notes
6/13/2020 - add JHU Genomic Data Science + JHU Biostatistics in Public Health notes
6/14/2020 - add JHU Genomic Data Science notes
6/21/2020 - add JHU Genomic Data Science notes
6/24/2020 - add JHU Genomic Data Science notes
6/25/2020 - minor formatting changes
6/28/2020 - add JHU Genomic Data Science notes
7/3/2020 - add JHU Genomic Data Science notes
7/4/2020 - add JHU Genomic Data Science notes
7/31/2020 - add JHU Genomic Data Science notes
8/2/2020 - add JHU Genomic Data Science notes
8/3/2020 - add JHU Genomic Data Science notes
8/5/2020 - add JHU Genomic Data Science notes
8/6/2020 - add JHU Genomic Data Science notes
8/8/2020 - add JHU Genomic Data Science notes
8/14/2020 - add JHU Genomic Data Science notes
12/26/2020 - add JHU Genomic Data Science notes
12/27/2020 - add JHU Genomic Data Science notes
12/29/2020 - add JHU Genomic Data Science notes
12/30/2020 - add JHU Genomic Data Science notes
12/31/2020 - add JHU Genomic Data Science notes
1/1/2021 - add link to earlier Udemy course
1/2/2021 - add JHU Genomic Data Science notes
1/7/2021 - add JHU Genomic Data Science notes
1/25/2021 - add JHU Genomic Data Science notes
3/3/2021 - add JHU Genomic Data Science notes
3/7/2021 - add JHU Genomic Data Science certificates
3/31/2021 - add Udemy FileMaker course + minor changes
6/12/2021 - minor change and reformatting for Harvard edX Data Science for the Life Sciences
6/13/2021 - add Harvard edX Data Science for the Life Sciences notes
6/14/2021 - minor changes
6/16/2021 - add Harvard edX Data Science for the Life Sciences notes
6/19/2021 - minor change
6/20/2021 - add Harvard edX Data Science for the Life Sciences notes
6/23/2021 - add Harvard edX Data Science for the Life Sciences notes
6/26/2021 - add Harvard edX Data Science for the Life Sciences notes
6/27/2021 - add Harvard edX Data Science for the Life Sciences notes
6/28/2021 - add Harvard edX Data Science for the Life Sciences notes
10/8/2021 - add Harvard edX Data Science for the Life Sciences notes
10/9/2021 - add Harvard edX Data Science for the Life Sciences notes
10/10/2021 - add Harvard edX Data Science for the Life Sciences notes
10/11/2021 - add Harvard edX Data Science for the Life Sciences notes
10/12/2021 - add Harvard edX Data Science for the Life Sciences notes
10/14/2021 - add Harvard edX Data Science for the Life Sciences notes
10/17/2021 - add Harvard edX Data Science for the Life Sciences notes
10/19/2021 - add Harvard edX Data Science for the Life Sciences notes
10/23/2021 - add Harvard edX Data Science for the Life Sciences notes
10/24/2021 - add Harvard edX Data Science for the Life Sciences notes
11/25/2021 - add Harvard edX Data Science for the Life Sciences notes
11/26/2021 - add Harvard edX Data Science for the Life Sciences notes
11/27/2021 - add Harvard edX Data Science for the Life Sciences notes
 
Creative Commons License
My Biomedical Informatics Blog by Charles Warden is licensed under a Creative Commons Attribution-NonCommercial-NoDerivs 3.0 United States License.