Showing posts with label RFMix. Show all posts

Monday, September 16, 2019

Examples of Visual Critical Assessment for Ancestry Chromosome Painting

[this post is a collection of images to try and make my points from this Twitter discussion more clear]

NOTE: After creating this blog post, I created this Biostars discussion.  I think this is a little shorter and perhaps a better format for discussion.  So, you can want to consider looking at that discussion instead of (or in addition to) this post.  Thank you very much for your interest.

As also mentioned in this other post, my African ancestry (whether that is what most people would consider to be African, or ancestors that migrated out of Africa relatively more recently) should come from my father's side.

While upstream phasing by SHAPEIT can also be a factor, I did some RFMix re-analysis with various data types, including the result below:
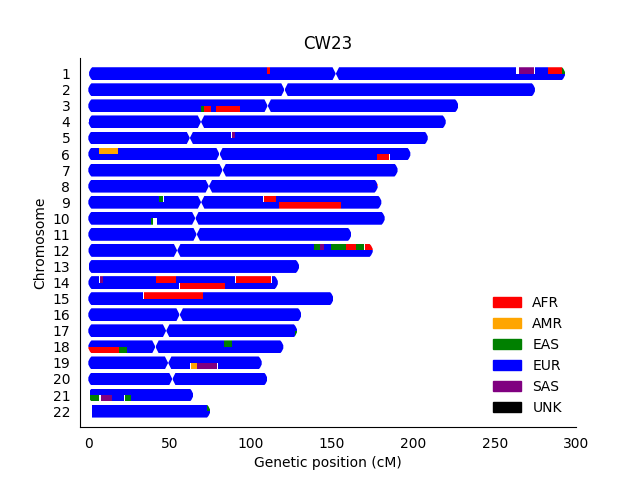


Assuming that each row represents a chromosome that I inherited from each parent, the most clear problem is that the African (AFR red ancestry) should really only be on one copy of chromosome 14 (and I assume the adjacent European EUR segments are not precise, and there should really be one larger segment).

While I am not entirely certain about the underlying method, there is also an example where I think visual inspection can be useful for a result from basepaws.  While my notes are messy (and sometimes incomplete), you can look here for more information (if desired).  I purchased ~15x Whole Genome Sequencing for $1000 (to get raw data), rather than the more typical $95 for low coverage Whole Genome Sequencing (lcWGS) and Amplicon-Seq for health markers.

So, I don't exactly have my own basepaws report, but I think there is a fairly new version of broad ancestry assignments (via chromosome painting) that can be viewed on page 3 of this PDF (for another cat).  In terms of separate images that I can find on-line, this blog post with an earlier report (again, for another cat) has ancestry painting, but it doesn't have the same problem.  Likewise, the chromosome painting plot on this blog post doesn't have the same issue.

So, I will just verbally say that the cat chromosome painting on on page 3 of this PDF looks off in that the broad ancestry assignments seem to be the same on both copies of each chromosome.  To be fair, they aren't always the same (which is good - I think the ancestry for most cats should probably be relatively independent for each chromosome copy).

However, in terms of giving advice for troubleshooting, I can also show you my attempted RFMix analysis (which clearly has problems, and I wouldn't recommend for returning as a result for anybody else).
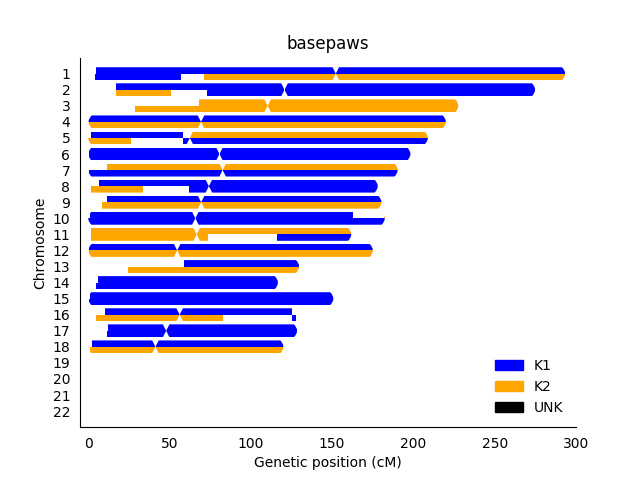
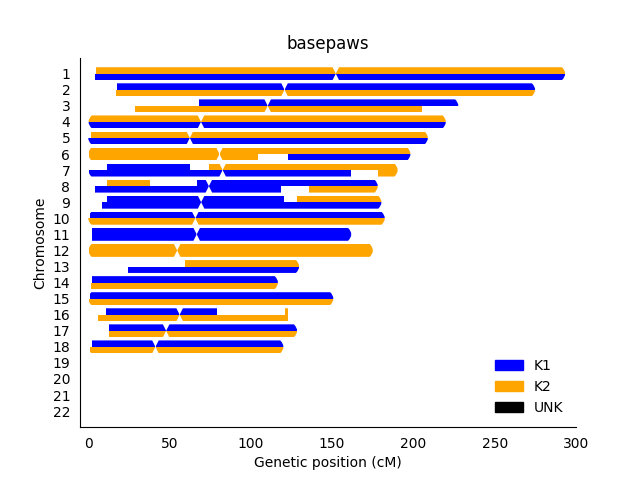


Now, the chromosome copies do show more independent ancestry (per chromosome copy), but the results are not reproducible.  However, in that particular context (performing re-analysis of my cat's data), I thought ADMIXURE and PCA (using public reference samples) did have reasonable results.  So, I think there were other strategies (which I would probably consider "simpler" strategies that I thought did give reasonable results), which is good and important.  While there may be a problem in the assumption of use for some more specific breeds (such a single markers for the Scottish Fold or Sphynx), my point is that I consider the ADMIXTURE and PCA results to be OK for the broader ancestry (meaning I think there is some sort of robust ancestry result that can be provided for cats).

Nevertheless, the overall goal was to be able to visually identify likely problems with inheritance (and/or limitations to precision for ancestry results), and I think the above plots are OK for that.

That said, even this troubleshooting should probably be thought of as "hypothesis generation."  In other words, if your first assumption when seeing results like I have shown above is not "Something looks like it could / likely is wrong," then I think this is helpful in terms of needing to critically assess genomics results.  However, it is also important that you then try to think of ways to identify the more specific problem.  While phasing may be an issue with the human 23andMe results and the more limited number of probes / markers for the public reference samples is my expected problem with the basepaws cat RFMix analysis, you generally gain confidence in a result when you keep trying find a problem (and you keep finding valid explanations for the results).  So, in some ways, it may be best to call my critique a "hypothesis."  For example, saying I couldn't get reasonable RFMix results for my cat analysis (and I should also admit that there could also be some sort of bug that I haven't been able to find) is not the same of saying some sort of chromosome painting analysis is not possible in the future (as long as the underlying biological assumption is valid).

Change Log:

9/16/2019 - public post date
2/6/2020 - add Biostars discussion link

Sunday, August 4, 2019

Human Low-Coverage Sequencing is Mostly OK for Broad Ancestry and Relatedness

This is a subset of my notes from my Nebula lcWGS sequencing on GitHub (as well as a couple images from two sections with Genes for Good, for full probe RFMix as well as RFMix SNP-chip down-sampling):

Ancestry Predictions

Even though I think they should only provide continental ancestry results (kind of like the 1000 Genomes "super-populations"), the ancestry was roughly similar to my other results (indicating that I am mostly European, which is accurate).  Plus, I describe limits on the more specific assignments (for SNP chip data) in another blog post.

Nevertheless, if I use my imputed genotypes for RFMix chromosome painting, I get results that look roughly like my SNP chip analysis (which would be an improvement over the Genes for Good imputed SNPs, but comparable to the much smaller number of Genes for Good observed SNPs):


There is no plot for chrX, in part because there are no imputed genotypes for chrX.

For comparison, this is what the full set of observed Genes for Good probes looks like:


and this is what the larger set of imputed Genes for Good probes looks like:


In other words, I think the Nebula results are similar (or perhaps slightly worse) than the genotypes that were directly measured for Genes for Good SNP chip probes (which, by the way, are completely free to obtain),  but imputation process also caused some issues with the ancestry with the Genes for Good SNP chip probes.

However, to be fair, the loss of accuracy with imputation does seem be better than using observed measurements if you decrease the probes and/or reference samples enough.  Shown below is the effect of using only 66 reference samples and 15,924 probes: (20x reduction in 1000 Genomes unrelated reference set, and 18x reduction in probes from my Genes for Good SNP chip):


Although, to be fair again, I think the primary problem is arguably the number of reference samples.  Take a look if I use the same number of probes (15,924 probes), but I have the "full" set 1,329 unrelated reference samples:


However, to get something that looks more like the original result, I would argue you do need to arguably increase the probes as well.  For example, please note a similar plot below with 143,320 probes (2x reduction in the starting amount):


Given that I think this looks kind of similar to the Genes for Good imputed set, I think the original Nebula imputed result (with lcWGS) for broad-level ancestry is a reasonable match to the higher coverage results (all things considered).


Kinship / Identity-By-Descent (Close Family Relationships)

Similar to the IBD estimates that are posted within the Helix/Mayo GeneGuide GitHub section (since I was only provided a gVCF), I can test overall similarity between the imputed Nebula genotypes, 23andMe (CW23), Genes for Good (GFG), Veritas WGS (BWA-MEM Re-Aligned) with 77,072 genomic positions (plotting 1000 Genomes reference samples for comparison):


By this measure, you can also clearly see which samples come from the same individual (me).  However, there is a slight drop in the accuracy for the Nebula imputed values (with kinship values between 0.489181 and 0.489226, instead of between 0.499859 and 0.499962):

FAM1 ID1 FAM2 ID2 nsnp hethet ibs0 kinship
0 CW23 0 GFG 77072 0.605148 0 0.499962
0 Veritas.BWA 0 GFG 76310 0.605032 0 0.499865
0 Veritas.BWA 0 CW23 76310 0.605032 0 0.499859
0 Nebula 0 GFG 77072 0.584596 7.78493e-05 0.489209
0 Nebula 0 CW23 77072 0.584596 7.78493e-05 0.489181
0 Nebula 0 Veritas.BWA 76310 0.58472 6.55222e-05 0.489226
In other words, there is some loss in the genome-wide similarity using low-coverage Whole Genome Sequcing (lcWGS), but you can still clearly tell which samples all same from the same individual (me).

However, if the underlying data is not reliable for traits and health results, then my opinion is that the SNP chip is still the relatively better option (as something that costs less than higher coverage sequencing, while giving ancestry /  relatedness results that are at least as good).


That said, to be fair, I think it really could be best if I could see similar example from those with a different primary (Non-European) ancestry.  For example, there was this New York Times article about someone whose broad-level ancestry assignments were less accurate than mine (although there was also evidence for improvement over time).  For example, most people were predicted to be mostly European (regardless of their actual ancestry) and most customers were European, then you could have a result that looks good even though it wasn't actually a very good predictor (beyond a baseline, like "assume everybody has European ancestry").

Update Log:

8/4/2019 - public post date
8/6/2019 - minor changes
8/15/2019 - minor changes
8/21/2019 - add "human" to the title
9/15/2019 - add warning / note about others with a different main broad ancestry

My Genome-wide, Broad-Level Super-Population Ancestry was Robust, but I Observed Some False Positives in Smaller or Specific Segments

You can get an idea of the specific (country) assignments for ancestry in the various sub-folders on GitHub as well as sometimes in reports that I uploaded to my personal genome project page.

First, the good news: most companies indicate that I am mostly of European Ancestry, which is correct.

Second, the mixed news: while there were some findings that were correct, I had concerns about emphasizing a non-trivial false positive rate for some of the more specific ancestry predictions.  For example, I respectfully believe it is inappropriate for 23andMe to encourage travel destinations based upon their ancestry results.

To some extent, the names themselves sometimes indicate a limit to precision.  For example, if the category is "British & Irish" or "French & German," then you already don't have 1 country for a travel recommendation.  While I do have both British and Irish ancestry (and accordingly, those have the best specific marker evidence), I am a little concerned about the basis of some of the more specific assignments that I currently see.  For example, does overall population affect the density of likeihood that I had relatives from London?  If so, I think that would be kind of like assuming I live in either LA or NYC because I am from the United States (technically, I do live in the greater LA area, but I was born in Cincinnati and raised in Atlanta - plus, I think this is probably sufficient to make my point).  Also, it looks like that density plot is somewhat contradictory with the marker status, even within 23andMe.

While this sort of thing may be hard to firmly prove (for example, convergence between companies does not necessarily indicate the result is accurate, which we saw in a different way for my cystic fibrosis result), I have examples of the sort of things which I did or did not consider to be accurate below.

While some of these could be correct, I think it may sometimes be best to think of them like "hypotheses".

Positive Examples of More Specific (Relatively Recent) Ancestry


  • AncestryDNA predicted that I had more recent relatives in Tennessee, which is correct (on my mother's side).  However, even that may have had some limits to precision, given that the 1925-1950 interval seems less relevant to what I know.
  • 23andMe predicted that I had relatives living in Kingston Parish less than 200 years ago.  This could be correct.  Based upon my other family members, I can tell that this comes from my father's side with a relatively robust prediction of ~2-3% African ancestry (with large segments on multiple chromosomes).
    • I thought I had heard that my Great-Great-Grandfather (my Grandfather's Grandfather) was supposed to have been born from family that moved from the Caribbean to the United States (but I don't currently have confirmation of that).  
    • I also have consistent reports of Y-chromosome lineage E-M123.  While I am not sure if that is completely consistent with what I have described above, the greater African ancestry could be coming from Great-Great-Grandfather's father's mother's side (and/or his mother's side).


Effect of Filtering 23andMe Ancestry for Results with Higher Confidence Threshold


  • While I believe the above explanation for my African ancestry is plausible, there were 2 other specific ancestry predictions that I didn't think were right (and, in fact, those could be filtered by increasing the confidence threshold to 90%)
23andMe V3 Chip Ancestry Results (3/21/2019, 50% Confidence)

23andMe V3 Chip Ancestry Results (3/21/2019, 90% Confidence)

As noted in the GitHub notes, the East Asian & Native American and South Asian results go away with the higher confidence threshold (90%, instead of the default 50%).

What is not as clear from the above plots is that I also have notes of my percent Scandinavian ancestry varying from 11% to 3% (both with the V3 chip, at various times), and this is something that I think should have been called "Broadly European" instead of being assigned to a country that I believe is incorrect).  Accordingly, my Scandinavian ancestry also disappears if I change the confidence interval.  For other 23andMe customers, note the pull-down in the upper-right of the above screenshots.  That is how you can get the more conservative predictions (even though, in my opinion, I think it should be the other way around, where you have to opt-in for more speculative results).

I can also perform chromosome painting re-analysis with RFMix with 1000 Genomes reference samples, which I have shown below:


The overall picture is still that I am of mostly European ancestry.  You now start to get some small SAS (South Asian) predictions, but I think this is consistent with my general suggestion that the smaller segments are more likely to be false positives.

Also, all the segments of African ancestry should be coming from my father's side.  So, even though I think the above plot is good for some sense of overall estimates (for large segments), there is some sort of issue with phasing for my large SHAPEIT/RFMix chr14 segments (all the red should be 1 of my 2 copies of Chromosome 14, similar to my 23andMe results).  However, to be fair, there are chromosome-discordant 50% confidence results in my 23andMe data (with the smaller segments on Chromosome 3), which are on the same chromosome for this particular SHAPEIT/RFMix result (although that may also vary with different random seeds on different days).

Going back to the official 23andMe results, I purchased an upgraded V5 chip, and you can see those results below.

23andMe V5 Chip Ancestry Results (7/11/2019, 50% Confidence)

23andMe V5 Chip Ancestry Results (7/11/2019, 90% Confidence)


You now get a East Asian and Native American segment that remains with the higher confidence threshold.  However, using the same rationale as the SAS RFMix segments, I think the 0.1% segment on chr3 (surrounded by regions that were filtered with the higher confidence threshold) should receive less emphasis based upon the size of the segment.  So, if you ignore that (or just look at the most common ancestry prediction), the results for the V3 and V5 chips are consistent with each other (and other companies) with the broad conclusion that I am of mostly European ancestry.

On the flip side, I should also have some Spanish ancestry, which I don't see with the 90% confidence threshold.  However, I can see that ancestry with 50% confidence on chromosome 3 - in fact, that segment is estimated to be larger (2.1% versus 1.3%) in a later ancestry estimate.  So, unless that ancestry is being represented in another way (defined less precisely), this could be an example of a false negative with the higher confidence threshold.


Free Alternate Ancestry Prediction Options


  • I describe these in more detail on the 1000 Genomes re-analysis page for my 23andMe data (on GitHub).  However, I provide the general links here:
  • Again, it might be possible to have a false positive from multiple programs.  However, I think it is an overall good thing that you have these free options for re-analysis available.


To be clear, I am defining a difference between ancestry and relatedness.  In 23andMe, these are even in different sections ("Ancestry" versus "Family & Friends").  As mentioned in another blog post (please scroll towards the bottom), I believe the close family predictions should be accurate (even though I got a weird result when I uploaded my 23andMe data to FamilyTreeDNA).

However, to be clear, I think "specific" closely related individual predictions should be accurate (and I could in fact verify predicted relatives up to the range of second cousin on 23andMe and AncestryDNA), and this is the different than the more distant "specific" country assignments.  This matches 23andMe's definition of a "close relative."  However, it is hard for me to assess the accuracy of the confidence estimates for increasingly distant "DNA relative" predictions.

Update Log:

8/4/2019 - public post date
8/6/2019 - minor changes
8/14/2019 - minor changes
8/15/2019 - mention issue of RFMix phasing for African ancestry
8/16/2019 - minor changes
9/15/2019 - change title to just refer to myself
9/16/2019 - add link about DNA.land
10/18/2019 - mention aunt with Turner Syndrome (later removed, along with entire section)
10/22/2019 - minor change
12/2/2019 - add links to inpute.me and MySeq
1/27/2020 - add note about Great-Great-Grandfather (later removed)
1/29/2020 - modify notes (based upon what I could verify, even though I will probably have more revisions)
2/1/2020 - further modify notes
2/2/2020 - further modify notes
2/4/2020 - modify content throughout post (including changing the name of the section related to changing the 23andMe confidence thresholds, as well as removing some other details and the section about my mom's chromosome X)
2/5/2020 - additional changes in wording
2/6/2020 - minor changes
3/10/2020 - minor change
 
Creative Commons License
Charles Warden's Science Blog by Charles Warden is licensed under a Creative Commons Attribution-NonCommercial-NoDerivs 3.0 United States License.