Showing posts with label limits to genomic models. Show all posts

Sunday, August 4, 2019

Concerns About Using Low-Coverage Sequencing for Trait or Health Results

This is a subset of my notes from my Nebula lcWGS sequencing on GitHub:

NOTE (2/24/2020): Nebula is currently offering 30x sequencing.  So, my concerns about the low coverage Whole Genome Sequencing (lcWGS) at ~0.5x are probably less relevant for that particular company.  However, if you get lcWGS from another company, then this information is probably relevant.

Concerns about Specific Variants

While I very much support providing FASTQ, BAM and VCF data, one of my concerns about the Nebula results was the use of low-coverage sequencing.

So, one of the first things that I did was visualize the alignments for some of my more confidently understood variants from previous data (using IGV).

For the two alignments below, the Genos Exome is the top alignment, the Nebula low-coverage alignment is in the middle, and the Veritas Whole Genome Sequencing (WGS, regular-coverage) is at the bottom.

My cystic fibrosis variant (rs121908769):


My APOE Alzhiemer's risk variant (rs429358, Nebula alignment in middle, variant is red-blue bar in the right-most exon):


For APOE, I zoomed out from the screenshot so that you could get a better perspective of the error rate per-read at other positions around the gene.

You could see my cystic fibrosis variant in the 1 read covered at that position, but you can't see any reads with the APOE variant.  My concern about the use of low-coverage sequencing is due to imputation (at least for traits).  Even though this APOE variant is somewhat common (I believe ~15% of the population), the imputation failed to identify me as having that variant.  You see that from the .vcf files

My APOE Alzhiemer's risk variant:

19      45411941        rs429358        T       C       .       PASS    .       GT:RC:AC:GP:DS  0/0:0:0:0.923102,0.0768962,1.71523e-06:0.0768996

As described in the gVCF header:

GT = Genotype
RC = Count of Reads with Ref Allele
AC = Count of reads with Alt Allele
GP = Genotype Probability: Pr(0/0), Pr(1/0), Pr(1/1)
DS = Estimated Alternate Allele Dosage

The "0/0" (for genotype/GT in the last column) means that low-coverage imputation couldn't detect my APOE variant.  In other words, I believe Nebula incorrectly estimates my genotype to be 0/0 with a probability of 92.3%, and the probably for the true genotype was 7.7%.  I also see a blog post mentioning that these probabilities are provided to users through the web-interface, although I am having difficulty in finding them without the gVCF (and you won't see them in the PDFs that I have uploaded in this section).

Update (8/5): Nebula support got in touch with me and explained that the blog post is in reference to Nebula Research Library (rather than the "Your Traits" section).  I canceled my subscription, I am still able to confirm that I see this under the "Library" section (rather than "Traits," "Ancestry," or "Microbiome").

Likewise, there was no delTT variant in the VCF, so my cystic fibrosis carrier status would also be a false negative (if that was used in the report), even though you could actually see that deletion in the 1 read aligned at that position (because 1 read wasn't sufficient to have confidence in that variant).

Overall Variant Concordance

I can also use my VCF_recovery.pl script to compare recovery of my Veritas WGS variants in my Nebula gVCF.

If you compare SNPs, then the accuracy is noticeably lower than GATK (and even lower than DeepVariant):


3,071,596 / 3,419,611 (89.8%) full SNP recovery
3,184,641 / 3,419,611 (93.1%) partial SNP recovery

The indels are harder to compare (becuase of the freebayes indel format).  So, in the interests of fairness, I am omiting them here (as I did for comparing the provided Genos Exome versus Veritas WGS variants).  However, instead of comparing the provided Veritas WGS .vcf file, I can try comparing the BWA-MEM re-aligned GATK Veritas WGS .vcf (which also had higher concordance between my Exome and WGS datasets):


3,133,635 / 3,419,611 (91.6%) full SNP recovery
3,248,277 / 3,419,611 (95.0%) partial SNP recovery
164,140 / 217,959 (75.3%) full insertion recovery
180,736 / 217,959 (82.9%) partial insertion recovery
190,452 / 266,479 (71.5%) full deletion recovery
213,131 / 266,479 (80.0%) partial deletion recovery

The GATK recovery is a little better.  However, it is very important to emphasize that the gVCF variants do not have 99% accuracy (even for average accuracy, or even for SNPs).  I think whatever benchmark was used for that calculation was probably over-fit on some training data.  To be fair, I think the average SNP chip concordance (with higher coverage WGS data) is also lower than some people might expect, but it is definitely higher than this lcWGS data.

You can also show similar results with precisonFDA (using the BWA-MEM realigned GATK gVCF, which we expect to have better concordance than the provided Veritas gVCF).

For example, the overall file shows noticably low recall when comparing the Nebula imputed gVCF versus the Veritas WGS BWA-MEM re-aligned gVCF:


and, to be more fair for the Exome versus WGS comparison in the blog post, the trend is similar within RefSeq CDS regions:


The screenshots are smaller than in the blog post because there was no precision-recall plot for the Imputed Nebula gVCF comparisons.

So, I  disagree with the use of low-coverage sequencing for traits, and I would respectfully consider removing this section (or only made available to those with higher-coverage sequencing).

When I was trying to upload my raw data to my Personal Genome Project page, I noticed that they had an option called "genetic data - Gencove low pass (e.g. Nebula Genomics)".  This makes me think discouraging low-coverage sequencing is something that needs to be done more broadly (at least for health traits).


Concerns abut Nebula Library Results

My concerns for the previous sections are probably solved when using the higher coverage sequencing data.  So, unless you were an earlier customer and had the lower coverage sequencing data, you probably don't have to be extra careful about possibly overestimated accuracy in your genotype imputations.

However, there is one thing that I think could still be a problem for customers with higher coverage sequencing data (if the reports are the same).  The concept is similar to my concern about the basepaws breed index (described in this blog post) and/or other Polygenic Risk Scores that I have collected for myself, but I think I can explain my concern with the top 3 percentile results that I received from Nebula:


As you can see from this link, the percentile above was calculated using 13 SNPs.  Seven of the thirteen SNPs are on chromosome 6, and 5/7 of those variants didn't have alignments against the main reference chrososome (for hg19) in my higher coverage Veritas Whole Genome Sequencing data.  Nebula predicted 3-4 of those 7 chromosome 6 variants to be homozygous variants, but I am not sure if these are correct or not (and the nucleotide for rs3763312 was different from the variants in dbSNP).  There were a pair of variants on chromosome 10 where I was predicted to be heterozgyous at both sites.  For the remaining 6 non-chr6 variants, I had imputed genotypes for 2 heterozygous variants, 2 homozygous non-reference variants, and 2 homozygous reference variants (and they matched my higher coverage WGS data).

I am only 34, but I definitely don't have hair that looks like the Google images for this disease.  So, I don't know the expected age of onset, but I think I might never get this condition (even though Nebula says that I am at the 100th percentile).


As you can see from this link, the percentile above was calculated using 15 SNPs.  12 of those SNPs had at least 1 variant from the reference genome and 11/12 of those variants matched by Vertias WGS variants.  The discordant variant was rs6910071, which was homozygous for the variant allele on the Nebula lcWGS imputed variants.  So, this could have been consistent with 90% overall accuracy, but I didn't have coverage for either dataset at this position (so, this isn't the same as using a gVCF to make a homozygous reference genotype call).

I have osteoarthritis in my lower back, but I don't believe that I (currently) have rheumatoid arthritis.

While I could believe that I am at increased risk, it is important to note that the summary only describes 4% of variance in disease risk.  I think this should be described for all of the reports, to give a sense of the predictive power (along with other statistics).

I also noticed most of the variants were not present in ClinVar (when I was using dbSNP to check the hg19 genome coordinates and reference allele).


As you can see from this link, the percentile above was calculated using 56 SNPs.

I have blood test results uploaded on my PatientsLikeMe profile, and I thought that I had a normal CRP result.  However, it appears that I might not have remembered that correctly, and I might need to wait until my next checkup to see if I can test my CRP level.  However, this is something where I think it would be relatively easy to show if being at the 99% percentile substantially affects your observed CRP levels (or whether there are limits to what this score represents).


As you can see from this link, the percentile above was calculated using 6 SNPs.  Nebula predicted that I had a homozygous variant for 1 SNP and heterozygous variant for 1 SNP (and reference genotypes for the other 4 variants).  However, all of these variants looked OK in my higher coverage Veritas WGS data.

I believe that I have been previously reported to be at higher risk for restless leg syndrome, but that might have actually been for deep vein thrombosis / venous thromboembolism in the earlier 23andMe reports (before the FDA required approval for a more select set of results).  I do sometimes have difficult sitting perfectly still at night.  However, this does't happen all of the time, and I have never been diagnosed by a doctor for having this condition.  So, I would currently lean towards saying that I don't have restless leg syndrome.

For the 2 sets of SNPs that I checked (for alopecia areata and restless leg syndrome), I also visualized my Genos Exome alignment.  However, most of the variants were not covered by sequencing of coding regions.

In general, the journals where these results are published may make some readers think the results are useful.  However, being able to publish a result in a prestigious journal doesn't mean the associations are predictive enough to be clinically meaningful.  Also, even with a more subtle association, being in a prestigious journal doesn't necessarily mean the result can be reproduced.  For example, there are retractions in high impact journals (you can see some in this blog post), and there are objectively wrong conclusions in papers that haven't been retracted (and the science-wide error rate is mentioned in this blog post).  I don't want to cause unnecessarily alarm, but I think it is important to emphasize that time and large sample sizes (and independent validation) are needed to become comfortable with using genetic results to guide your medical treatment.

Nebula does provide a warning: "Disclaimer: Nebula Library is for research, information, and educational use only. This information is not medical advice, nor is it intended to be used for any diagnostic purpose. Please seek the assistance of a health care provider with any questions regarding your health."  However, I think this is easy to miss and the importance may not be fully understood among all customers.

Additional Note #1: I tried to provide a review for Nebula on Trustpilot, but I have encountered some difficulties.  You can see a screenshot of the current review (that was not accepted) here.  While I still haven't gotten a response for the last attempt to submit a review and get an explanation of what I need to change.  While I am not certain if this is the cause, the link that I received to submit a review initially created a review under another name.  To be fair, Nebula did pay me the $10 Amazon gift card (even when I provided a screenshot of a 2-star review, when most are 4- or 5-star reviews), and I hope that this review can eventually be posted (in which case, I will provide a link to that review, instead of this longer explanation).

Additional Note #2: You can see my report to FDA MedWatch (MW5093887) in MAUDE here.  I received an acknowledgement via mail for another report, but I just looked for this report after waiting a while.

Update Log:

8/4/2019 - public post date
8/5/2019 - add update about Nebula research library
8/6/2019 - minor changes
8/10/2019 - add link for 23andMe SNP chip versus WGS concordance
8/14/2019 - minor changes
8/15/2019 - minor changes; add box around APOE variant
8/16/2019 - minor changes
8/17/2019 - revise title (to better emphasize importance, but also presentation of just my own data)
8/16/2019 - minor changes
11/26/2019 - add arrows to Nebula samples in IGV screenshots
1/26/2020 - add screenshot of Trustpilot review
2/24/2020 - mention that Nebula is currently offering higher coverage sequencing
3/19/2020 - add concerns about Nebula Library (to match what I described in my MedWatch report)
3/20/2020 - add links to SNP details for selected library results
3/22/2020 - add link to other PRS post
4/18/2020 - add notes about checking RA post
4/24/2020 - add notes about FDA MedWatch submission
4/26/2020 - minor changes
7/6/2020 - minor changes "Polygenic Risk Score" label, for the last part of the blog post.

My Genome-wide, Broad-Level Super-Population Ancestry was Robust, but I Observed Some False Positives in Smaller or Specific Segments

You can get an idea of the specific (country) assignments for ancestry in the various sub-folders on GitHub as well as sometimes in reports that I uploaded to my personal genome project page.

First, the good news: most companies indicate that I am mostly of European Ancestry, which is correct.

Second, the mixed news: while there were some findings that were correct, I had concerns about emphasizing a non-trivial false positive rate for some of the more specific ancestry predictions.  For example, I respectfully believe it is inappropriate for 23andMe to encourage travel destinations based upon their ancestry results.

To some extent, the names themselves sometimes indicate a limit to precision.  For example, if the category is "British & Irish" or "French & German," then you already don't have 1 country for a travel recommendation.  While I do have both British and Irish ancestry (and accordingly, those have the best specific marker evidence), I am a little concerned about the basis of some of the more specific assignments that I currently see.  For example, does overall population affect the density of likeihood that I had relatives from London?  If so, I think that would be kind of like assuming I live in either LA or NYC because I am from the United States (technically, I do live in the greater LA area, but I was born in Cincinnati and raised in Atlanta - plus, I think this is probably sufficient to make my point).  Also, it looks like that density plot is somewhat contradictory with the marker status, even within 23andMe.

While this sort of thing may be hard to firmly prove (for example, convergence between companies does not necessarily indicate the result is accurate, which we saw in a different way for my cystic fibrosis result), I have examples of the sort of things which I did or did not consider to be accurate below.

While some of these could be correct, I think it may sometimes be best to think of them like "hypotheses".

Positive Examples of More Specific (Relatively Recent) Ancestry


  • AncestryDNA predicted that I had more recent relatives in Tennessee, which is correct (on my mother's side).  However, even that may have had some limits to precision, given that the 1925-1950 interval seems less relevant to what I know.
  • 23andMe predicted that I had relatives living in Kingston Parish less than 200 years ago.  This could be correct.  Based upon my other family members, I can tell that this comes from my father's side with a relatively robust prediction of ~2-3% African ancestry (with large segments on multiple chromosomes).
    • I thought I had heard that my Great-Great-Grandfather (my Grandfather's Grandfather) was supposed to have been born from family that moved from the Caribbean to the United States (but I don't currently have confirmation of that).  
    • I also have consistent reports of Y-chromosome lineage E-M123.  While I am not sure if that is completely consistent with what I have described above, the greater African ancestry could be coming from Great-Great-Grandfather's father's mother's side (and/or his mother's side).


Effect of Filtering 23andMe Ancestry for Results with Higher Confidence Threshold


  • While I believe the above explanation for my African ancestry is plausible, there were 2 other specific ancestry predictions that I didn't think were right (and, in fact, those could be filtered by increasing the confidence threshold to 90%)
23andMe V3 Chip Ancestry Results (3/21/2019, 50% Confidence)

23andMe V3 Chip Ancestry Results (3/21/2019, 90% Confidence)

As noted in the GitHub notes, the East Asian & Native American and South Asian results go away with the higher confidence threshold (90%, instead of the default 50%).

What is not as clear from the above plots is that I also have notes of my percent Scandinavian ancestry varying from 11% to 3% (both with the V3 chip, at various times), and this is something that I think should have been called "Broadly European" instead of being assigned to a country that I believe is incorrect).  Accordingly, my Scandinavian ancestry also disappears if I change the confidence interval.  For other 23andMe customers, note the pull-down in the upper-right of the above screenshots.  That is how you can get the more conservative predictions (even though, in my opinion, I think it should be the other way around, where you have to opt-in for more speculative results).

I can also perform chromosome painting re-analysis with RFMix with 1000 Genomes reference samples, which I have shown below:


The overall picture is still that I am of mostly European ancestry.  You now start to get some small SAS (South Asian) predictions, but I think this is consistent with my general suggestion that the smaller segments are more likely to be false positives.

Also, all the segments of African ancestry should be coming from my father's side.  So, even though I think the above plot is good for some sense of overall estimates (for large segments), there is some sort of issue with phasing for my large SHAPEIT/RFMix chr14 segments (all the red should be 1 of my 2 copies of Chromosome 14, similar to my 23andMe results).  However, to be fair, there are chromosome-discordant 50% confidence results in my 23andMe data (with the smaller segments on Chromosome 3), which are on the same chromosome for this particular SHAPEIT/RFMix result (although that may also vary with different random seeds on different days).

Going back to the official 23andMe results, I purchased an upgraded V5 chip, and you can see those results below.

23andMe V5 Chip Ancestry Results (7/11/2019, 50% Confidence)

23andMe V5 Chip Ancestry Results (7/11/2019, 90% Confidence)


You now get a East Asian and Native American segment that remains with the higher confidence threshold.  However, using the same rationale as the SAS RFMix segments, I think the 0.1% segment on chr3 (surrounded by regions that were filtered with the higher confidence threshold) should receive less emphasis based upon the size of the segment.  So, if you ignore that (or just look at the most common ancestry prediction), the results for the V3 and V5 chips are consistent with each other (and other companies) with the broad conclusion that I am of mostly European ancestry.

On the flip side, I should also have some Spanish ancestry, which I don't see with the 90% confidence threshold.  However, I can see that ancestry with 50% confidence on chromosome 3 - in fact, that segment is estimated to be larger (2.1% versus 1.3%) in a later ancestry estimate.  So, unless that ancestry is being represented in another way (defined less precisely), this could be an example of a false negative with the higher confidence threshold.


Free Alternate Ancestry Prediction Options


  • I describe these in more detail on the 1000 Genomes re-analysis page for my 23andMe data (on GitHub).  However, I provide the general links here:
  • Again, it might be possible to have a false positive from multiple programs.  However, I think it is an overall good thing that you have these free options for re-analysis available.


To be clear, I am defining a difference between ancestry and relatedness.  In 23andMe, these are even in different sections ("Ancestry" versus "Family & Friends").  As mentioned in another blog post (please scroll towards the bottom), I believe the close family predictions should be accurate (even though I got a weird result when I uploaded my 23andMe data to FamilyTreeDNA).

However, to be clear, I think "specific" closely related individual predictions should be accurate (and I could in fact verify predicted relatives up to the range of second cousin on 23andMe and AncestryDNA), and this is the different than the more distant "specific" country assignments.  This matches 23andMe's definition of a "close relative."  However, it is hard for me to assess the accuracy of the confidence estimates for increasingly distant "DNA relative" predictions.

Update Log:

8/4/2019 - public post date
8/6/2019 - minor changes
8/14/2019 - minor changes
8/15/2019 - mention issue of RFMix phasing for African ancestry
8/16/2019 - minor changes
9/15/2019 - change title to just refer to myself
9/16/2019 - add link about DNA.land
10/18/2019 - mention aunt with Turner Syndrome (later removed, along with entire section)
10/22/2019 - minor change
12/2/2019 - add links to inpute.me and MySeq
1/27/2020 - add note about Great-Great-Grandfather (later removed)
1/29/2020 - modify notes (based upon what I could verify, even though I will probably have more revisions)
2/1/2020 - further modify notes
2/2/2020 - further modify notes
2/4/2020 - modify content throughout post (including changing the name of the section related to changing the 23andMe confidence thresholds, as well as removing some other details and the section about my mom's chromosome X)
2/5/2020 - additional changes in wording
2/6/2020 - minor changes
3/10/2020 - minor change

Emphasis on "Hypothesis-Generation" for Supplement Recommendations

This is a subset of my notes on 4 "Nutrigenomics" companies on GitHub:

To be fair, I am starting with a negative bias.  However, I will be very happy if I can convince people that the companies / organizations need to i) share your raw data with you, ii) share all the details for coming to their conclusions, and iii) have some way of publicly sharing trends in their own data, with fair representations in limitations in confidence.

In other words, that is a little different than the results being inaccurate, which is harder to show (and I have to be mindful of my prior expectations, since that can cause me to be overly harsh).

That said, my primary concern with most of the Nutrigenomics results is that they weren't the best way to get your genomic data (and/or they provided risk assessments that I thought were less useful than direct measurements, such as routine blood tests covered by insurance).  However, the situation was a little different for Vitagene (who does provide genotype information at 632,150 positions).

While my opinion is that I would probably still prefer 23andMe / Genes for Good / All of US over Vitagene, I think that can largely be considered a personal preference.  However, I think there is one point worth emphasizing more (which I feel more strongly about).

Namely, Vitagene provides supplement recommendations based upon your genotypes (and non-genetic information).

While I did experiment a little with 1 supplement because of these results (and may eventually test 1 or 2 more), I think it was important that I viewed the overall results as something that needed to be critically assessed.

In other words, Vitagene recommended that I take 7 supplements:


  • Bromelain Quercetin Complex (500 mg): Lifestyle (Joint health and Digestive health)
  • Probiotics (40 billion CFU): Genetics (31%, risk of Overweight, Hormonal support, Eczema, Allergies and Blood pressure health, based upon 103 variants, all reported to have "Fair" research quality), Lifesytle (Everyday stress and Digestive health), and Goals (Everyday stress and Overweight)
  • Vitamin D (2000 IU): Genetics (59% Vitamin D Levels, Eczema and Joint health, based upon 36 variants, all reported to have "Fair" research quality), Lifesytle (Everyday stress), and Goals (Everyday stress)
  • Theanine (200 mg): Lifesytle (Everyday stress), and Goals (Everyday stress)
  • Iron Free Multivitamin (10 Multi): Lifestyle (Energy and Nutrient intake levels)
  • Zinc (15 mg): Genetics (50% Overweight, based upon 52 variants, all reported to have "Fair" research quality) and Goals (Overweight)
  • Chromium (200 mcg): Genetics (83% Hormonal support, Overweight and Blood Sugar Health, based upon 203 variants, all reported to have "Fair" research quality) and Goals (Overweight)

To be clear, I believe I currently have a normal BMI (23.7), but I would like to trim down my gut a little bit.  However, I think doing some 8 minute abs and exercise (and avoiding over-eating) is probably going to be more helpful to me than a supplement to lose weight.  I only bring this up because "Overweight" appears more than once above.

More importantly, if I over-estimated the ability to accurately make supplement / drug recommendations, I think this could potentially cause harm.

For example, I would be cautious about taking 7 new drugs all of a sudden.  While they attempt to give some indication of drug interactions (such as listing a potential drug interaction between Bromelain and Indomethican), I didn't see a warning about an interaction between L-Theanine (specifically, Nature's Trove L-Theanine) and SSRIs except on the container after ordering the supplement.

Accordingly, I encountered some minor side effects both times that I took it (as I recorded in my PatientsLikeMe profile).  To re-iterate, there was a warning on the container (but not from Vitagene) said "If you are currently taking prescription antidepressants such as MAOIs or SSRIs, consult your physician before taking this product".

I also tested 50 mg of Zinc from target (which I evaluated on PatientsLikeMe).  However, I don't think it really helped with weight loss (after testing taking it for a little less than 2 weeks).

So, this was not a huge problem for me.  However, I would be a little concerned if the typical patient/customer didn't question the full set of recommendations (and/or didn't consult a doctor prior to adding a large number of supplements into their daily routine).  It may also be worth mention that the supplement I ended up testing (as something novel that I thought could help) did not use any of my genetic information to make that recommendation.

Update (3/8/2020): I submitted an FDA MedWatch report for this collection of blog posts, emphasizing the Vitagene result because of the mild adverse reaction (while providing the FDA with the general link).  Identifying information was removed, but you can see what the public version of report MW5092056 looks like in the MAUDE Adverse Event Report database.

Update (4/27/2020 + 5/24/2020): I don't mention it in the above post (since I made the purchase noticeably later), but I think my GitHub notes on Dante Labs may also be relevant (1 of the 3 reports was a "Nutrigenomics" report).  I have also submitted an FDA MedWatch report, and I will provide the identifier for that as soon as I know it.

I am not sure why the information about Dante Labs is missing (since that seems important), but you can see that report in MAUDE as MW5094322.  You can also see the original draft (without the removed information or reformatted text) here.

Update (5/18/2010): When I thought I heard that Everywell was going to provide COVID-19 tests, I thought that I should report my experiences for what appears to be different metabolite levels for the regular blood draw versus the at-home blood test (MW5094002).  I also mentioned that DNA results were provided, but I didn't think they were the best way to get those results and I thought the blood test results should be getting more emphasis.  As mentioned toward the beginning, this was one of the results that I described in greater detail on the GitHub Nutrigenomics subfolder.


Update Log:

8/4/2019 - public post date
8/16/2019 - minor changes
8/20/2019 - mention zinc testing
8/26/2019 - fix GitHub link
8/30/2019 - add link for PatientsLikeMe zinc evaluation
11/20/2019 - add Chromium (all 7 supplements were on the GitHub page, but I previously only listed 6 in the blog post)
3/8/2020 - add link to FDA MedWatch report
4/27/2020 - add information about Dante Labs
5/18/2020 - add reference to Everywell FDA MedWatch report
5/24/2020 - add reference to Dante Labs FDA MedWatch report

Saturday, May 18, 2019

Emphasizing "Hypothesis Generation" in Genomics

With terms like "precision medicine," I believe there is an expectation that that genomics will remove ambiguity in medicine.  I certainly agree that it can help.  However, I think it is also important to realize that "hypothesis generation" and "genomic profiling" are also common terms in genomics, which imply some uncertainty and a need for further investigation.

I think there more work needed to have a fair and clear description of the importance to limitations to genomic analysis, but I believe concepts like over-fitting and variability also be important.

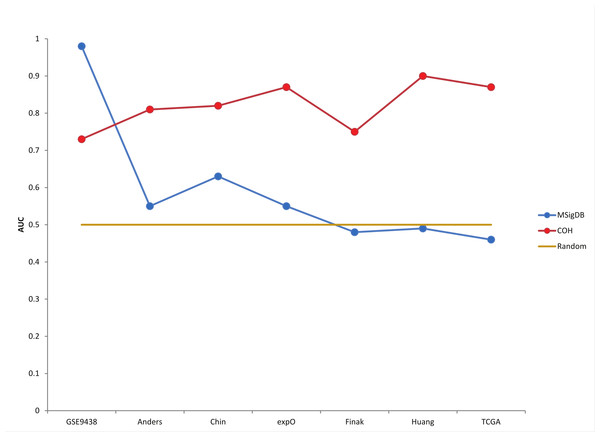
Here is a plot that I believe can help explain what I mean by over-fitting :


The plot above is from Warden et al. 2013.  Notice that very high accuracy in one dataset (from which a signature was defined) actually resulted in lower accuracy in other datasets (which is what I mean by "over-fitting").  The yellow horizontal line is mean to be like the diagonal line in AUC plots.  While 50% accuracy is not actually the baseline for all comparisons (for example, if an event or problem is rare, then saying something works 0% of the time or 100% of the time may actually be a better baseline).  Nevertheless, I think this picture can be useful.

When I briefly mentioned "variability," I think that is what is more commonly thought of for personalized / precision medicine (solutions that work in one situation may not work as well as others).  However, I also hope to eventually have an RNA-Seq paper to show that testing of multiple open-source programs can help towards having an acceptable solution (even if you can't determine the exact methods should be used for a given project ahead of time).  I think this is a slightly different point in that it indicates limits to precision / accuracy for certain genomics methods, while still showing overall effectiveness in helping answer biological questions (even though you may need to plan to take more time to critically assess your results).  Also, in the interests of avoiding needless alarm, I would often recommend people/scientists visualize their alignments in IGV (a free genome browser), along with visualizing an independently calculated expression value (such as log2(FPKM+0.1), calculated using R-base functions); so, if you think a gene is likely to be involved, that can sometimes be a way to help gauge whether the statistical analysis produced either a false positive or a false negative for that gene (and then possibly provide ideas of how to refine analysis for your specific project).

This is also a little different than my earlier blog post about predictive models in that I am saying that over-fit models may be reported to be more accurate than they really are (whereas the the predictive power of the associations described in that post clearly indicate population differences have limitations in predictive power in individuals).  However, I think that level of predictive power for the SNP association is in some ways comparable to the "COH" gene expression model shown above (where roughly 80% accuracy is actually more robust, and therefore arguably more helpful, than a signature with >90% accuracy in one cohort but essentially random predictions in most other cohorts).

I think that also matches this Wu et al. 2021 commentary, where performance noticeably drops in Table 1 when an AI model is trained at one site and tested at another (with highest performance coming from the same site as training).  However, this is a little different than what I showed above (where lower performance on the same dataset may result in relatively better performance in different datasets for the BD-Func plot, but I think the maximal performance is more correlated in the AI commentary table with a loss across in performance in new sites across all 3 rows).  If there was at least 1 additional row with non-AI models that had more similar performance on the same site and different sites (but lower performance than the AI model on the same site), then that would be more similar to the BD-Func example.

Also, I think it should be emphasized that precision medicine doesn't necessarily have to involve high-throughput sequencing, and I think using RNA-Seq for discovery and lower-throughput assays in the clinic is often a good idea.  For example, the goal of the paper was a little different, but the feature being predicted in that plot above is Progesterone Receptor immunostaining (I believe protein expression for ER, PR, and HER2 are often checked together for breast cancer patients).  So, just looking at the PGR mRNA might have had more robust predictions in validation sets than the BD-Func "COH" score (which was a t-test between up- an down-regulated gene expression, per-sample).

There are positive outcomes from genomics research, and there are some things that can be known/performed with relatively greater confidence than others (such as well-established single-gene disorders). However, I think having realistic expectations is also important, and that is why I believe there should be emphasis on both "precision medicine" and "hypothesis generation" when discussing genomics.  Or, I actually prefer the term "personalized medicine" over "precision medicine," which I think can capture both of those concepts.

Change Log:

5/11/2019 - this tweet had some influence on re-arranging my draft (prior to public posting), in terms of the expectation that personalized medicine / genetics can explain / improve therapies that originally did not seem very effective.
5/18/2019 - public blog post
5/20/2019 - update link for "personalized medicine," add sentence in 1st paragraph, and remove "medicine" from title (and one sentence in concluding paragraph).
5/22/2019 - I don't remember why I had this in the draft for the generics post.  While I don't think it fits in with the flow of the main content, I wanted to add this as a slide note relevant to general limitations in precision (even when a program is incredibly useful): As mentioned in this tweet, BLAST is of huge benefit to the bioinformatics / genomics community, even without choosing a "typical" 0.05 E-value cutoff (to be more like a p-value).
5/26/2019 - add Mendelian Disease as "success story" for genomics
4/8/2021 - add link to article about issue with retrospective studies and decrease in performance between sites
 
Creative Commons License
Charles Warden's Science Blog by Charles Warden is licensed under a Creative Commons Attribution-NonCommercial-NoDerivs 3.0 United States License.