Showing posts with label genomics. Show all posts

Tuesday, December 20, 2022

Metagenomics Classifications Across Human And Cat Samples

As previously described, part of the reason why I collected a 2nd Whole Genome Sequencing (WGS) sample from Basepaws in order to have raw data to re-analyze for 2 time points (which include Dental Health Test reports).

One of the points raised in that blog post was to improve coverage for germline variants.  I do see some evidence for improvement in Bastu's heterozygous dilute variant.  However, I primarily wanted to better understand and assess the metagenomics classifications (related to the Oral/Dental Health Test), and those are the primary focus for this blog post.

The exact format for the FASTQ files for the Basepaws raw data was different for the 2nd WGS sample than the 1st WGS sample.  The 1st WGS sample had a format more similar to what was provided by other companies, so I wrote a script to confirm the file format for the 2nd WGS samples.  This requires some familiarity with programming (even if mostly to comment or uncomment lines to run), so I am not sure how much it will help with reformatting for all customers.  Nevertheless, you can see the code and details for the file reformatting and the analysis below here.  A summary of data that I am sharing (and I would be interested to see from others) is provided here.

There are different strategies for metagenomics analysis.  For Basepaws, I believe that either regular coverage WGS or low-coverage WGS (lcWGS) is being used for oral microbiome classifications.  There are some human fecal samples where I describe the details of the sequencing design for samples collected from multiple companies here.  The human oral samples are also a mix of different companies and different sequencing design (such as WGS/lcWGS versus 16S Amplicon-Seq).  All cat fecal samples come from PetQCheck.

While I have not looked in as much depth to the sequencing type and re-analysis details for the other raw data, I have at least one oral and at least one fecal sample for myself and my cat Bastu.

The oral samples for myself are from uBiome, Bristle Health, and any WGS data collected for any purpose (Veritas, Sequencing.com, Nebula, etc.).  The oral samples for my cat Bastu only come from Basepaws.

The fecal samples with raw data for myself come from uBiome, Psomagen/Kean, and thryve/Ombre.  The fecal samples for my cat Bastu only come from PetQCheck.

For previous human comparisons, the company / sequencing design had a noticeable effect on the results.

However, if I go back and use a method that is at least capable of providing some classification for all of the sequencing types (Kraken2/Bracken), then I can re-analyze all of those data types together and visualize how they cluster:


I have added clustering for the species (human or cat) and the collection site (oral or fecal).  If Pearson Dissimilarity (1 - Pearson Correlation Coefficient) is used as the distance metric for clustering, then samples cluster primarily by sample site (oral versus fecal).  For example, all fecal samples intended for microbiome analysis do tend to have Bacteroides classification rates.  

Additionally, Veritas only provided reads aligned to human chromosomes in a BAM (Binary Alignment Mapping) alignment file that I converted to paired-end FASTQ files (the reads used for the classifications above), so I expect all accurate assignments should be relatively close to 0% for that sample.  So, this may be one reason to be skeptical about differences in the Basepaws WGS samples with this classification method, which show differences from each other and vary at a level similar to the Veritas samples should really close to 100% true human reads.

I also created another heatmap, only looking at assignments with the Top 20 genera assignments with highest average read fractions (calculated as percentages after removing Eukaryotic reads, which is also how the values for the first heatmap was calculated):


In that view, it looks like there might be additional Prevotella classifications for the cat fecal samples.  However, I have not looked into the details of the PetQCheck sequencing design, to make sure it matches at least one set of human samples.

Additionally, independent of overall clustering, I think it is encouraging that there is greater detection of Faecalibacterium in the fecal samples than the oral samples (for both species).

Also, unlike the human oral sample that should have only contained human (hg19) reads, the human oral samples showed some similarities that were noticeable beyond the differences in sequencing design.

For advanced readers, you can see some additional testing for alternate normalizations here.  However, I think the main conclusions are the same, and (if anything) there is possibly a less clear distinction for the negative control approximation (and the Basepaws samples) with the other normalizations.

Also more for the advanced readers, but you can also see some troubleshooting where I looked for even coverage in representative sequence alignments here.  If a classification is made for a large fraction of reads but coverage is uneven, then I would say those classifications are more likely to be false positives.  For example, in the above images (or here), you can see some higher reads given Staphylococcus and Pseudomonas assignments in the negative control approximation.  Those representative genomes also have uneven coverage in these Bowtie2 alignments or these BWA-MEM alignments.

Finally, as yet another option for more advanced readers, you can see some alternative methods of running Kraken2/Bracken.  Perhaps of note, there is supposed to be an implementation of KrakenUniq within later version of Kracken2 (referred to as "Kraken2Uniq", where I added the parameters "--report-minimizer-data --minimum-hit-groups 3" based upon this protocol):


Without adding the minimizer parameter for the KrakenUnique implementation within Kraken2, increasing the minimum number of hit groups to 10 ("--minimum-hit-groups 10") also reduces similarity between the approximate human negative control and the Basepaws oral Whole Genome Sequencing samples (at least with the latest versions of Kraken2 and Bracken):

Using a larger database can substantially reduce the run-time.  However, there is some additional information uploaded on GitHub for that option, if using a reduced set of total reads for some samples.  You can see a large difference in the Komagataeibacter classification rate for the larger database versus the more stringent requirements for the smaller "MiniKraken2 database.

In other words, I think these are important take-home messages:

  • Human and cat fecal samples form a cluster for that collection site, and they separate by species within that cluster (although PetQCheck is the only source for any cat fecal samples).
  • The Veritas sample was provided to me as chromosome alignments, rather than reads.  By definition, this means that the reads were aligned to the human genome, so I consider "Vertias_WGS" to be a negative control approximation.
  • Both the human fecal and oral samples contain a mix of Whole Genome Sequencing (WGS) and targeted sequencing for the 16S bacterial gene (16S Amplicon-Seq).  So, when these samples cluster together, I consider that a relatively robust result (even if there are also additional factors contributing to the exact abundance values, such as the company and the sequencing design).
  • On the contrary, the 2 Basepaws samples are less similar to each other than the different companies / libraries for my human oral samples.  Additionally, if there no no additional troubleshooting, then there is relative clustering between the Basepaws oral cat samples (particularly Basepaws_WGS2) and the human negative control approximation.

In term of trying to understand the Basepaws cat oral samples, there is a noticeable negative shift in the fragment size estimated by Picard (particularly for the first sample):

If the classifications can be reproducibly run in the same way, then I hope sharing reprocessed data might help with helping develop more of an opinion of the cat Oral/Dental Health Test from Basepaws.  I have started a discussion thread here.  In the Basepaws oral health test preprint, I also have additional comments, and I would be interested to hear feedback from others.  My understanding is that Kraken2/Bracken was also used in the preprint, but I think something about the exact way that the program was run was different.  Also, if I understand correctly, then I don't think the program can take the paired-end read information into consideration if the file is in an interleaved format (as provided for my cat's 2nd Basepaws WGS sample); however, I am not sure how important that is.  Within the GitHub discussion, I also provide some information for my human oral microbiome report from Bristle Health.

I would say the Basepaws Oral/Dental Health Test risk assessments were not a great match for my cat's individual dental health assessed by the vet.  However, I understand that the risk assessment is not meant to provide a diagnosis, and I am therefore still not completely sure what I think about the results.

That said, I feel comfortable saying that I wish raw data was provided for all of the Oral/Dental Health Test results from Basepaws (not only for the Whole Genome Test).

So, I hope this contributes some interest and encourages discussion on the topic!  I have some notes for the Basepaws Oral/Dental Health Test here, but I would be interested in seeing re-processed raw data with similar classifications (if possible).


Change Log:
12/20/2022 - public post date.
1/1/2023 - add content related to Kraken2/Bracken troubleshooting + revised take-home messages.
1/4/2022 - add note for Komagataeibacter assignments in Basepaws WGS1.

Saturday, July 2, 2022

Selected Comparisons for 2 Basepaws Whole Genome Sequencing Results

I already had an earlier Whole Genome Sequencing test from Basepaws, along with other results that can be viewed here or here.

However, I decided to order another test for the following reasons:

  • I would like to have some more raw data in order to help be better evaluate what I think of the Dental Health Results
  • 15x is a bit low, even though I think the alignments for what I checked looked OK.  So, if I am correctly understanding that the goal is to sequence ~20x (with small fragments such that the genomic coverage can be closer to 15x), then a 2nd set of raw data would get me closer to the 20x-30x that I think is more commonly considered "regular" coverage for inherited/germline variants.

When I received the PDF reports, I noticed something important that I brought to the attention of Basepaws.  After a lengthy (but timely) discussion, it was agreed that something was incorrect in the report.  My understanding is that this has been reported by at least one other customer, but Basepaws previously not realize the problem with the variant calling strategy (where I believe the earlier emphasis was on trying understand unknown biology, instead of the discussion's shifted emphasis on troubleshooting presentation of earlier findings).

So, due to the fact that this currently affects at least some other customers, I thought I would try to but a blog post together relative earlier than originally planned (with a shift in the intended emphasis, for now).

Reports / Data

1st Sample (Collected 3/14/2019):

Report (as of  6/15/2022): PDF

Report (as of  8/28/2022): PDF (includes corrected "C>T" variant)

FASTQ Read #1: HCWGS0003.23.HCWGS0003_1.fastq.gz

FASTQ Read #2: HCWGS0003.23.HCWGS0003_2.fastq.gz

2nd Sample (Collected 4/21/2022):

Report (as of 6/13/2022): PDF

Report (as of  8/28/2022): PDF (includes corrected "C>T" variant)

Interleaved FASTQ #1 (Run 186, Lane 1): AB.CN.45.31211051000777.LP.858.D9.L1.R186.WGS.fastq.gz

Interleaved FASTQ #2 (Run 186, Lane 2): AB.CN.45.31211051000777.SP.319.D1.L2.R186.WGS.fastq.gz

Interleaved FASTQ #3 (Run 195, Lane 2): AB.CN.45.31211051000777.SP.329.E1.L2.R195.WGS.fastq.gz

As mentioned on GitHub, I will most likely work on writing custom code to create reads in a similar file format as for the 1st WGS sample (which I prefer).  At that point, I will add additional links, but the originally provided data is still important.

Incorrect Colorpoint Mutation in Certain v4.0 Reports

(Basepaws Has Corrected Bastu's Reports, as of 8/28/2022)

    This is what I thought was important to communicate sooner rather than later.

    I was not expecting this to be something to pop-up, and I will try to explain some of the details in a bit.  The difference between the report and the data is important, but the issue can also be identified without that.

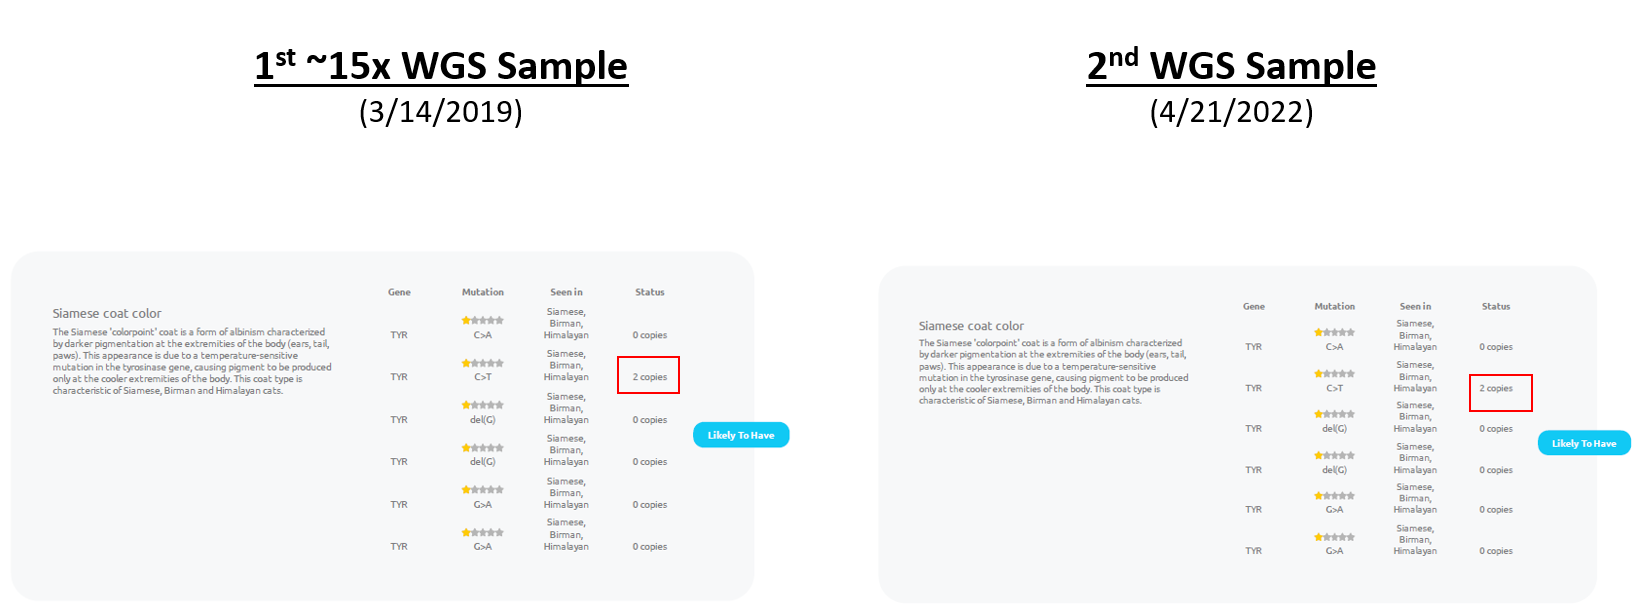
First, my cat was (incorrectly) listed has being likely to have the colorpoint trait in both reports:


As of 8/28/2022, the ability to tell that a report was more difficult than I expected because both sets of screenshots below are labeled as being version 4.0 reports:


Nevertheless, even if looking for the presence of the "black coat color result is not sufficient to tell if the "C>T" colorpoint variant has been corrected, I hope the content of this blog post can help you determine if a given v4.0 is likely to already have the correction or not.

I contacted Basepaws for the following reasons:

  • Even though you can have a Tortie Point cat, my cat does not have the colorpoint trait.
  • I have submitted samples to essentially all cat genomics organizations / companies that I was aware of.  While the markers could theoretically be different, the other results indicated that she has 0 copies of colorpoint mutations.  So, I wanted to check if the same variant was being tested.
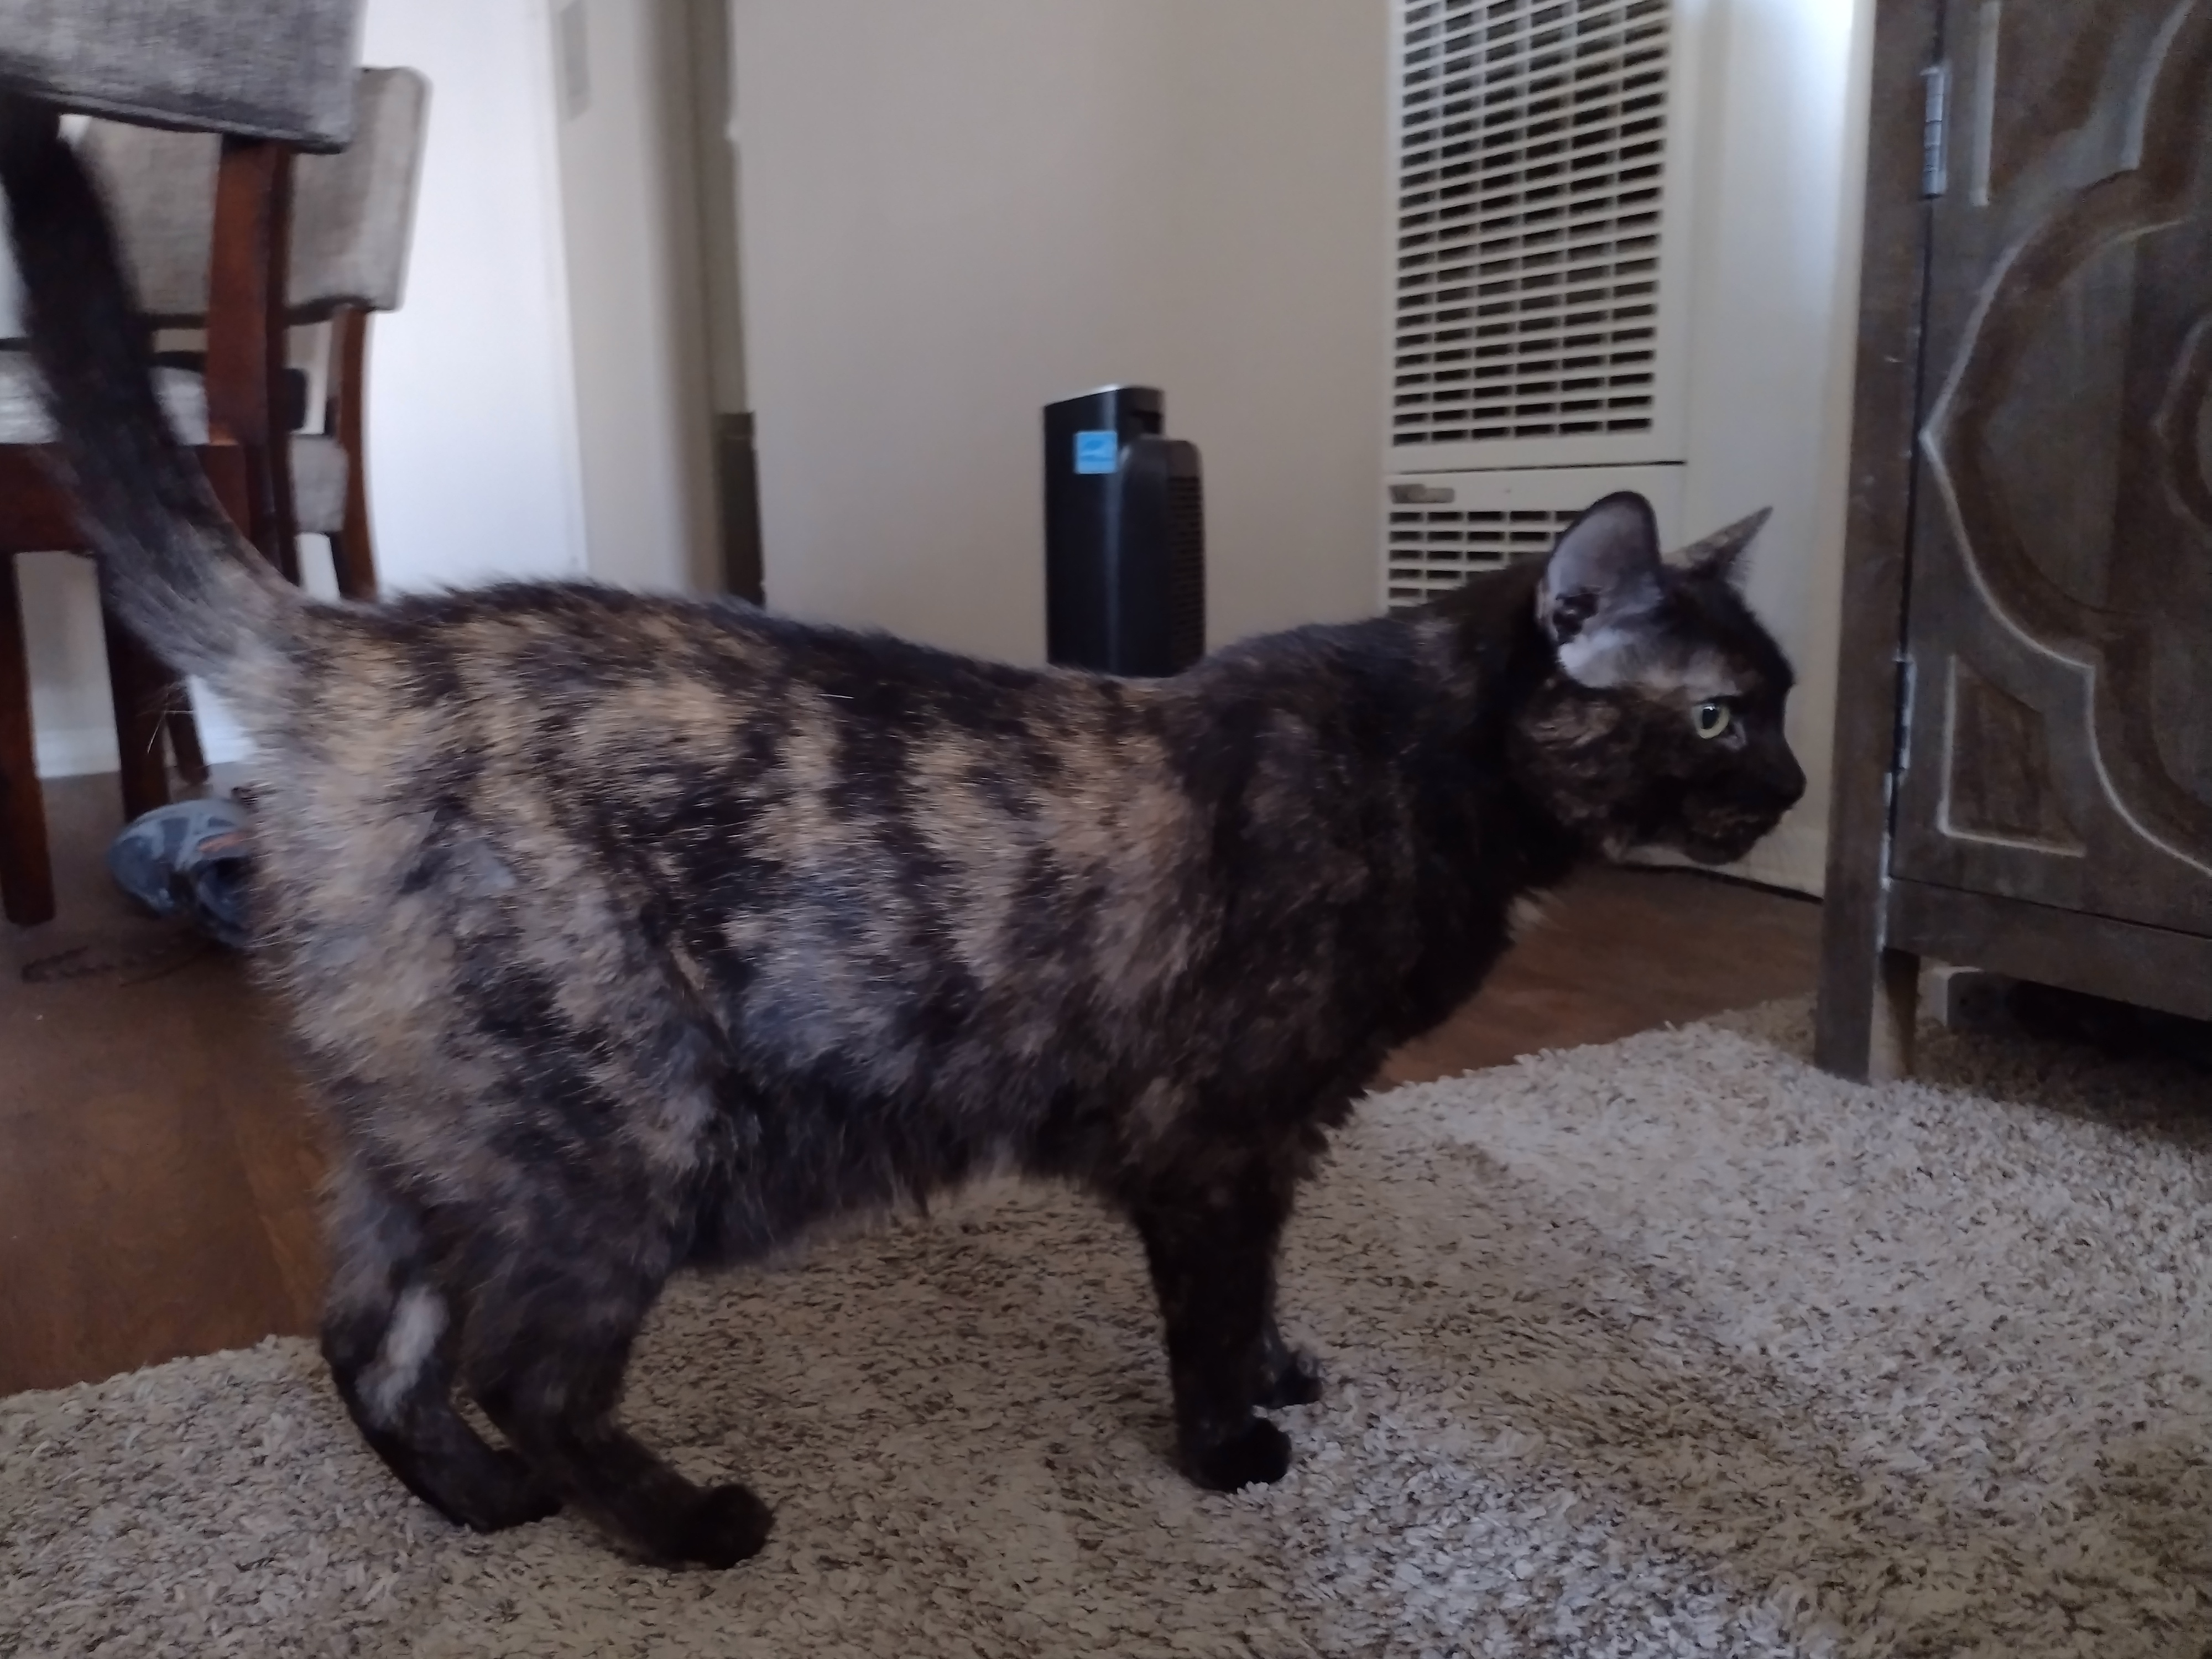
First, here is a photo of my cat (Bastu):


So, I think is reasonable to say she does not have the colorpoint trait.  There is also an additional illustration here (from this page) that I also think helps explain the colorpoint inheritance pattern.

There is also some discussion regarding traits in this Basepaws blog post, although I prefer the explanation for this page from UC-Davis (even though the result that I will show below are for the "Cat Ancestry" rather than the separate colorpoint test).

In terms of the UC-Davis VGL "Cat Ancestry" results for Bastu, you can see the trait marker results below:


The "C/C" result indicates that Bastu should neither have the colorpoint trait nor be a colorpoint carrier.

In terms of Wisdom Panel, you can see the results for some colorpoint markers below:


Bastu's Wisdom Panel results are split among multiple PDF exports of webpages.  However, the other traits that can be viewed in the same part of the interface can be seen here.

After discussion with Basepaws, my understanding is that the specific C>T mutation is a well-characterized variant, also called the "Siamese" colorpoint variant (with Basepaws staff passing along the Lyons et al. 2005 publication via e-mail).

There are some additional details from using raw data here, including selection of felCat9 chromosomal location to use.

However, after those additional troubleshooting discussions, the alignment to the best matched region of the felCat9 reference genome (with data from my cat's first WGS sample) is shown below:


As a matter of personal preference, I think alignments similar to shown above most clearly show the lack of colorpoint variants (from this position).  However, you can also see that from the Amplicon-Seq data that was used for the report (even though these are Whole Genome Sequencing kits).  As a special exception, Basepaws provided a file that they also used to say the future reports should report 0 copies instead of 2 copies.

I have a version of that file imported into Excel with highlighted 100% sequence matches from the Amplicon-Seq data that I uploaded here.

I later realized that there is a 1 bp difference for the felCat9 for the amplicon (the "T" at the end should have been a "C").  The strand of the amplicon is the opposite of the reported nucleotide, but the felCat9 alignment is on the positive strand for the amplicon.  In contrast, the amplicon aligns on the negative strand with respect to felCat8, but the difference is still at the end of the amplicon (which appears at the beginning of the alignment).

So, now, using the raw data, you can tell that the results in future Basepaws reports will need to be changed to reflect that my cat has 0 copies (instead of 2 copies) of the Colorpoint mutation.  The lack of mutations now matches her fur color pattern!

Of course, if you also have discrepancies between results from different sources, then you should also contact everybody who is relevant.

If this is a health marker (instead of a trait marker) and you can confirm the cause of the discordance in either direction for the same variant (either a false positive or a false negative), then I would also recommend that yous end an e-mail to the Center for Veterinary Medicine at the FDA.  I believe that some technical knowledge is needed to upload data and it is most commonly used for human data, but I have confirmed that veterinary data for pets is allowed on precisionFDA.  Additional effort would be needed to configure an app for cat re-analysis, but all re-analysis of raw data is free through the precisionFDA interface.  So, some parts are arguably not ideal for the average consumer, but my point is that a framework to share such data exists and having access to raw Whole Genome Sequencing data was important for resolving the troubleshooting described above.

Health and Trait Variant Calls

(for current Whole Genome Sequencing Samples)

    In my opinion, I believe that the availability of raw data is a unique advantage to Basepaws (at least if you order the Whole Genome Sequencing kit).  The process of returning that raw data took some follow-up on my part, but I don't know how many customers intentionally order the kit to be able to receive raw data.  I also preferred the fastq.gz formatting for the 1st WGS sample over the 2nd WGS sample, but I am not sure if that might further change in the future.

    So, it was to my surprise, the Whole Genome Sequencing data was currently not being used to call the colorpoint variant for my cat.

    My understanding is that is also true for the other health and trait markers currently provided.   As far as I know, the Amplicon-Seq results are usually OK.  However, I hope that either changes or the use of different data types is more clear in the report (even for the "Whole Genome Sequencing" kit), because I was expecting variant calls from the Whole Genome Sequencing data.

    There was a problem with using the Amplicon-Seq data for the colorpoint mutation, but my understanding is that programming problems to interpret the raw data were a factor.

    Even though Basepaws went back and generated a new Amplicon-Seq library from leftover genomic DNA for my 1st sample (before the Trait markers were offered), I will not be provided the raw Amplicon-Seq data for either sample.  My understanding is that this is due to the multiplex design that could be determined from the FASTQ files.  I don't think this is ideal.  However, as long as the data types are not mixed in one library, I am OK as long as I do receive the raw WGS data.  Again, if anything, I would argue the Whole Genome Sequencing (WGS) data appears to be the preferable way to at least evaluate the C>T "Siamese" colorpoint mutation.

Ancestry Results

(uses Whole Genome Sequencing Data)

You can see the results from the 2 Whole Genome Sequencing samples below:

There are some differences, but I think this is starting to get relatively closer to the limitations of my human results.  For example, I think my cat mostly has no Exotic purebred relatives (and 1 of 2 reports for the same cat have a 0% Exotic estimate). 

However, you can definitely tell that the higher coverage data helps.

Here are earlier plots comparing the low coverage Whole Genome Sequencing (lcWGS) results to my 1st Whole Genome Sequencing result:

"Confident":

"Possible":


You can clearly see additional problems in the ancestry results for the less expensive kits, with much lower coverage data used to impute genotypes.

I am not sure how much the relative revision of genomic reference sequence for the cat versus human may also matter, but I would guess that might have some impact on making a fraction of the genotypes harder to impute (and, therefore, the ancestry harder to predict).

This also gives me the impression that the new reports may only be providing the "possible" results (without the option to view the "confident" results that I prefer).  However, I will follow-up with Basepaws on that.  Either way, I would say the higher coverage data helped, but I think that is most clear with the "possible" confidence results.

Nevertheless, even at whatever is used as the current setting, you can see my cat has mostly Western and Polycat ancestry.  That is consistent with what I see from other companies and organizations for the same cat.

Eukaryotic Metagenomic Results

(can vary over time)

You can see the results from the 2 Whole Genome Sequencing samples below:


I am not currently sure what to think about this.

Dental Health Scores

(can vary over time)

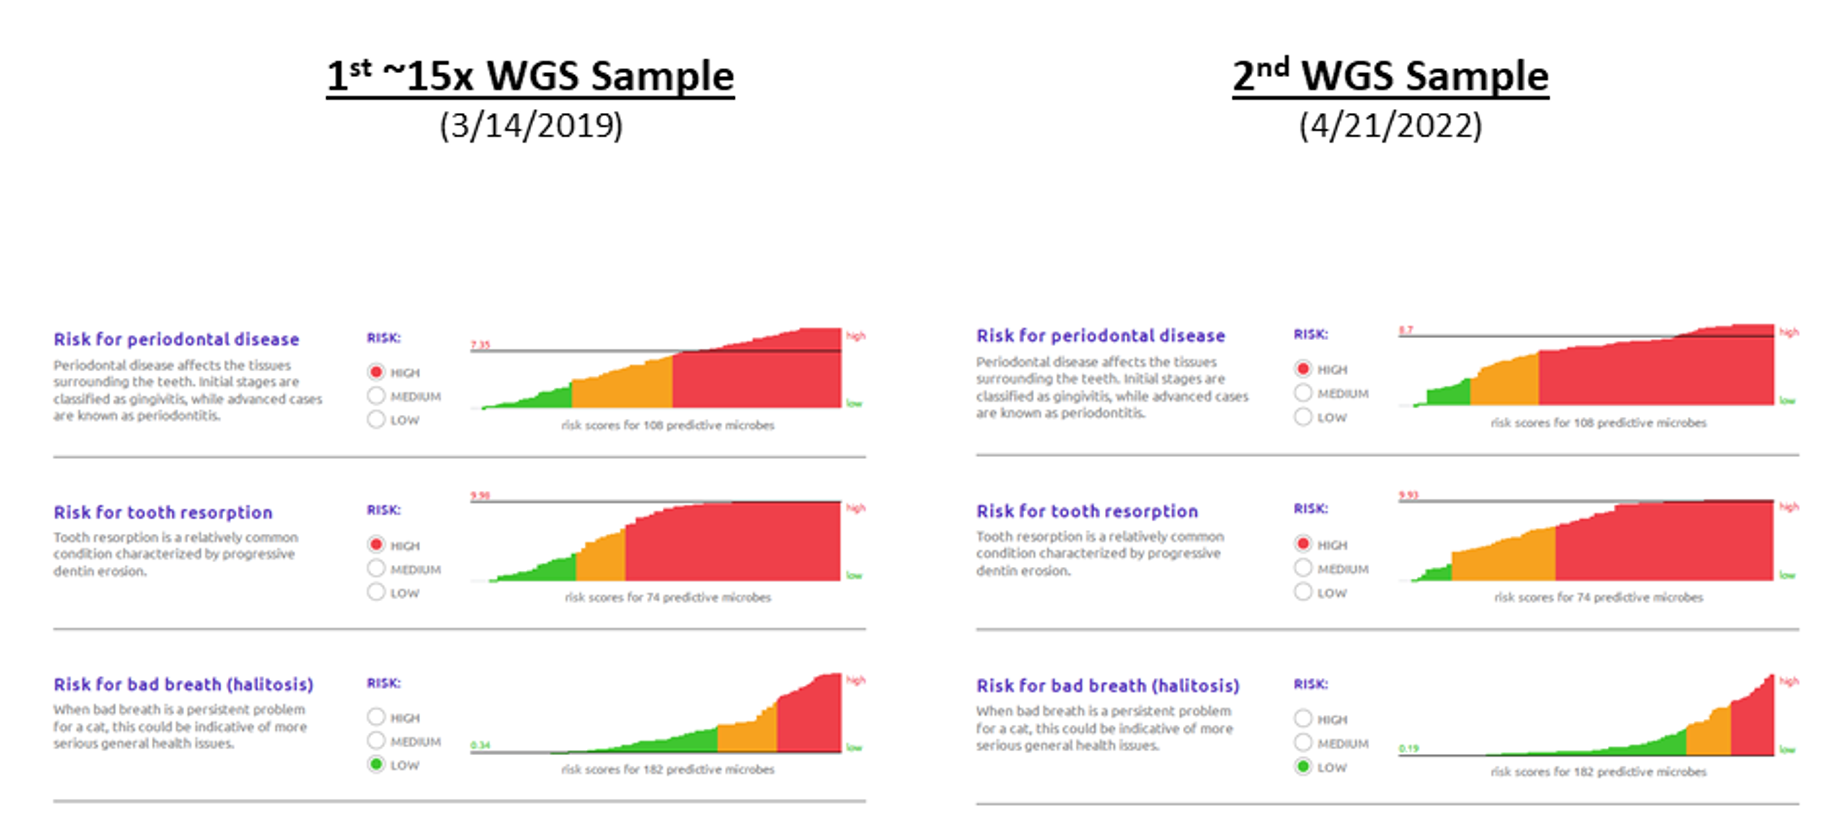
You can see the results from the 2 Whole Genome Sequencing samples below:


This is something that I hope that I can develop more of an opinion about over the next year or so.  For example, I have started a GitHub discussion where I list some things that I would like to look into and I certainly welcome additional feedback.

Similarly, I have already started a subfolder on this topic on GitHub that contains data/results and my thoughts so far.

One one hand, Basepaws has increased by general awareness of dental health in my cat.  For example, I have started discussions with my vet, and I think that is good.

However, I do not yet have a complete opinion regarding the Dental Health Test results.  For example, I would not actively recommend the Dental Health Test, but I am also not currently confident that there is a problem with the results that I can clearly explain.

Nevertheless, there are a few things that I would like to point out or comment about:

1) As I understand it, I think my cat has some of the highest "High Risk" scores that are plotted.  However, after multiple discussions with the vet, my understanding is that I should describe my cat as being in very good dental health for a cat her age.

My cat has been started on prescription dental diet, although my understanding is that is primarily a preventative measure given her age (and possibly my questions about dental health).  I will also take my cat in for the recommended yearly cleanings, and I believe that the vet confirmed that she doesn't currently need to come in more often.

Also, I believe that Basepaws has confirmed in an e-mail that the goal is to estimate risk and not to provide a diagnosis.  In other words, you can have a cat with a serious problem with low risk in the Basepaws Dental Health Test, and you can have a cat without a serious problem with high estimated risk.  My understanding is that cat falls in the second category.  The point is that something else needs to be performed by the vet to determine if your cat has a problem.

2) I saw an e-mail from 6/8/2022 titled "See what saved this kitty's life..." with a link to a blog post (which I believe was posted on 7/12/2021).

My initial reading and what I understood with  re-reading were different.  Because the test was collected considerably before any problems were observed, I think that is less of an concern.

However, what could have concerned me is if somebody noticed their cat had bad breath, ordered a Basepaws Dental Health Test, and then went to see the vet after receiving results from Basepaws 6 weeks later.

In other words, theoretically, I think this could have increased the risk of harm if there was an urgent problem.  The reason is that the Basepaws Dental Health Test can't tell you if your cat has a problem or not, and I would say you should start the process of trying to see your vet as soon as you notice a problem (not after waiting for a results that make take 6 weeks or more).  I could imagine a vet wanting to see if a symptom like bad breath persisted for some time before suggesting scheduling an appointment to bring the cat into the vet.  However, I would guess this waiting time might be more on the scale of days instead of more than a month?

For example, my understanding is the other cat was at "medium" risk in all 3 categories, which I would interpret as meaning the cat was at lower risk for than my cat (2 "high risk" scores and 1 "low risk" score for bad breath).  However, my cat had no serious dental health problems, and this cat with what I would consider to be at lower risk had a serious dental health problem.

I also had a question of "medium" risk versus "average" risk, but I have moved that to a footnote1.

So, I would at least consider bad breath a reason to call the vet and ask if the cat should come in.  I would not order a Basepaws Dental Health Test because my cat has bad breath (or any other novel symptom causing me concerns), and then wait for the results before scheduling an appointment with the vet.  I have also confirmed that Basepaws agrees you should not delay seeing your vet in order to obtain a Basepaws Dental Health Test result when you see a worrying symptom.

To be fair, I believe that I have seen at least one cat diagnosed to have a dental health problem with 3 "high risk" scores on the Facebook Basepaws Cat Club.  So, I hope that is helpful in getting an overall sense of the results.  However, I think the above examples are also important to take into consideration.

3) I think a well-characterized disease variant that has a second validation from the clinic could be different.  However, for the reasons above, I would have preferred that the Dental Health Risk scores were not added to my cat's medical record because of the discussion most immediately above.

However, I think the local vets have started to get to know my cat as an individual patient, so I would guess this is probably not an issue unless I had to see another vet (and that vet gave too much emphasis to those scores).

4) I remember previously reading about critiques from professors of veterinary medicine regarding the Basepaws Dental Health test in this Los Angeles Times article.  I have also added some comments on the preprint for the Basepaws Dental Health test, and I hope that others with relevant experience will do so as well (and I hope that there can be responses to comments from others).

However, again, I would certainly like to learn more!  You can either provide feedback as a comment, or there is a "discussion" enabled on the GitHub page.

Footnotes:

1When I asked about what represented "average" risk, Basepaws provided a link to the Dental Health Test whitepaper.  This is similar but not identical to the preprint.  So, I don't have a direct answer.  However, I can say that the preprint and the tables here were helpful in having discussions for my vet.

For example, I added an additional comment to the preprint regarding the positive predictive value estimation after talking to the vet.

The numbers in the whitepaper are slightly different (for example, there are 441 periodontal disease cats in the whitepaper and 570 periodontal disease cats in the preprint).  Nevertheless, if I use the preprint numbers, then I had possible estimates of positive predictive values for the combined high/medium group where I estimated the periodontal disease score might have positive predictive values of roughly 50% and the tooth resorption score might have positive predictive values of roughly 20%.

In every calculation that I attempt, the positive predictive value is noticeably lower for tooth resorption than periodontal disease.

For periodontal disease, I think the prevalence estimates and stage of the disease are important, but I wonder if might help to pose the question of whether something different than the standard recommended care should take place.  My current thought is to use the the vet's individual assessment (as independently from any estimate as possible) over the risk estimate, but I think conversations with your vet are worthwhile.  Basepaws clearly indicates the risk estimates should not be used as a diagnostic for dental health.

Change Log:
7/2/2022 - public post date.
7/3/2022 - add link to Dental Health Test GitHub discussion; also, as I went back to the possible confusion matrices that I created from the preprint to attempt to estimate the positive predictive value, I decided change wording for describing "medium" risk versus "average" risk as I look into the topic more; minor changes.
7/4/2022 - minor corrections; revise description of timing for other cat's dental health test.
7/7/2022 - update post after receiving e-mail response from Basepaws
7/10/2022 - add date to separate Basepaws e-mail from Basepaws blog post
7/16/2022 - formatting changes
7/17/2022 - after looking at 59 posted Dental Health Test reports, switch to only using the higher positive predictive value estimate.  The score distribution is different than the true prevalence, but that made me feel a little better about the possible positive predictive value.
7/20/2022 - minor changes + change footnote content
7/23/2022 - add additional UC-Davis VGL colorpoint link + minor formatting changes; add description of BLAT result with a minor difference from what I originally thought (mismatch at end, but not within BLAT hit); add link to product towards the beginning of the blog post.
7/24/2022 - re-arrange colorpoint background and provide photo of Bastu.
7/31/2022 - minor change to make Amplicon-Seq link earlier to find.
8/8/2022 - add link to Basepaws blog post acknowledging the fix.
8/14/2022 - add links to raw data for 2nd WGS sample (in format provided by Basepaws); update/modify section related to raw WGS data return and use of WGS data in reports.
8/16/2022 - formatting changes to make 2 hyperlinks easier to find.
8/23/2022 - upload alternative screenshot for Basepaws Siamese Coat Color result that is incorrect in the v4.0 report.
8/27/2022 - minor formatting changes
8/28/2022 - change tense for Basepaws correction, but also add content to explain how I have different v4.0 reports downloaded at different dates that are both before and after the "C>T" colorpoint variant correction; also, add links to reports that are downloaded more recently (with the corrected variant result).

Saturday, February 27, 2021

Why I think the basepaws "Breed Group" should be called an "Ancestry Cluster" (with abstract cluster names)

Part #1: Short Summary:

In the basepaws Facebook group, there are some noticeable issues with results for purebred cats that are not already part of the reference set (as I understand it).  To be fair, I have seen at least one report that was a good result (matching the known breed in a new test cat), but I think independent test datasets tend to be discordant with known purebred cats more often than they are concordant with new purebred cats (in the small fraction of customers where that can be tested).  Also, the majority of cats are mixed breed "Polycats" where there probably shouldn't be any close purebred relatives, and I think the results more-or-less match that expectation (if interpreted correctly, and I have found explaining precisely what I think is "correct" interpretation to be bit of a challenge).

Again, to be fair, basepaws does say "Disclaimer: The Basepaws Breed Index is not a breed test".  However, I think there is still some noticeable confusion.  So, regardless of whether my suggestion is helpful, I think it is safe to say you should not be using basepaws to confirm your cat's breed or disprove your cat's breed, and you may not have closely related cats for the "breed" with the highest estimated breed fraction in chromosome painting (which, in the wording of the current reports, may be "Breed Group" instead of "Breed Index" - either way, this is what you receive when you order the Breed + Health DNA Test, and you can see some type of chromosome painting in the various reports for Bastu).

After having several very helpful discussions, I thought of a possible suggestion that I thought might help: perhaps use a more abstract name for an ancestry group / cluster to make clear that you shouldn't use what is being provided to define breeds.

I think the best example may be the broad "Eastern" ancestry group, which is already in the reports (as a broader category) as well in previous literature on cat genomics.

If calculated accurately, I would expect Siamese cats will tend to have a higher estimate of Eastern contribution (at least for the "Traditional" Siamese cats, as I understand it).  However, I think the Colorpoint Restriction mutation might be what owners might want to check for cats with the characteristic hair color pattern.  For example, you might have to dig around a bit in the comments for this video but I believe "Lynx Point" cats can be defined from 2 markers (the Colorpoint Restriction variants, and Agouti variants for the tabby pattern).

Nevertheless, my point is that I believe giving the ancestry group the "Eastern" name adds a layer of conceptually separation than the "Siamese" (or related) breeds.

So, if technical problems are minimal, then I think this might reduce confusion for purebred cat owners (as well as minimize miscommunication from misunderstanding).  It might also reduce interest, but I would rather plan to have fewer customers than have more customers whose satisfaction might decrease over time.

It might also be worth noting that I believe most imputed genotypes are phenotypically neutral, meaning that they do not cause the traits that are used to define the breeds (although relatedness does define the breed, once it becomes established).

There are some additional details that I will discuss below, but I hope this can help for discussions (instead of me posting several comments, which may or may not be appreciated by all basepaws customers).  I also have a "Change Log" since I hope that I can update this based upon feedback, in order to try and be able to explain my point as precisely as possible.

Part #2: Intermediate-Level Details:

I have a separate blog post describing results (from multiple organizations / companies) for my cat Bastu.

However, I will copy / repeat some points below.  Some hopefully complement the main point for the "Short Summary," but some of these are separate points.

First, I think seeing 3 technical replicates for my 1 cat may be helpful in giving a sense of confidence in the results:

"Confident" Threshold


"Possible" Threshold


All 3 reports above were re-processed at the same time (for an update), but they were sequenced in different batches.

If you look at the broad ancestry groups, then there is some noticeable consistency with the technical replicates.  A mostly "Western" contribution for Bastu also makes sense, and that is also consistent with the her Ancestry Test from UC-Davis.

Please also note that the 1st 2 samples (left and middle) are low coverage Whole Genome Sequencing (lcWGS) and the report on the right is "regular" coverage sequencing (~15x).

For example, initiatively, I would not expect Bastu to be related to any Exotic breeds.  So, in addition to the general issue that accurately genotyped variation can exist before breed creation and confound the results, you can see the "Exotic" contributions go away in the higher/regular coverage sequencing data.

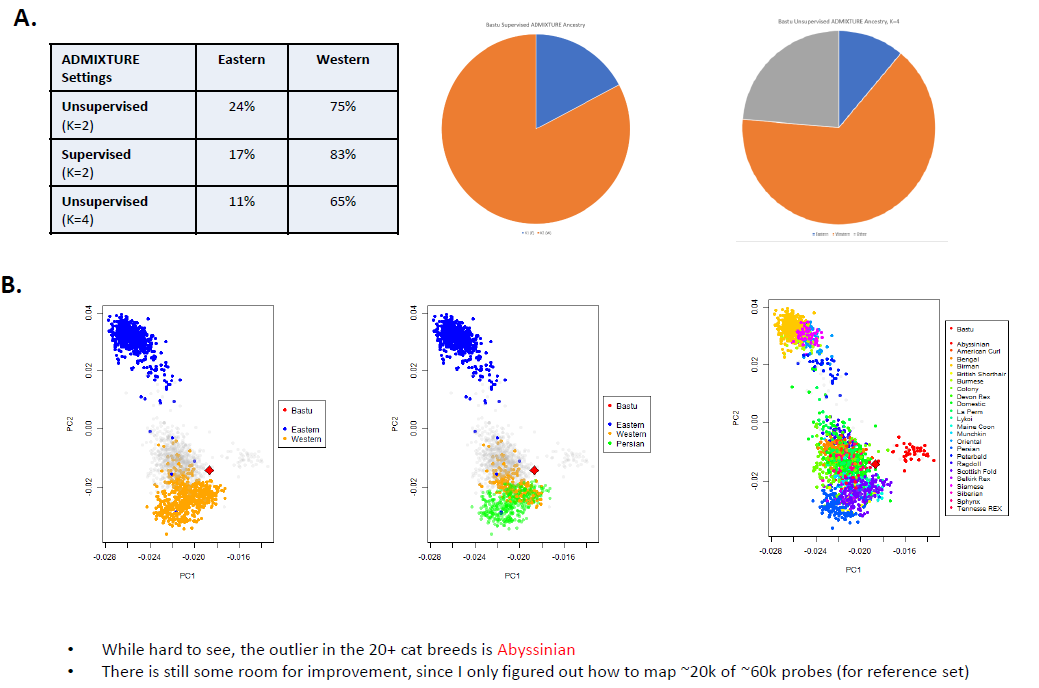
The main reason that I purchased the "Whole Genome Sequencing" kit was that I would get access to the raw data.  Since the price is different now, I will include the analysis part of this file below (without the header listing the original price):

Again, noticed the relatively higher Western contribution is also consistent with my re-analysis.


While I want to make clear that the PCA plots (the dots in the bottom part of the image, which I tried to describe as part "B") come from a relatively limited number of SNPs (from public cat SNP chips).  So, I don't know what the spread looks like if you could look like if you could see the individual points in the basepaws data, but I think plotting a centroid may not be the best way to represent the data (if that is what was done here).

There has also been at least 1 sample mix-up (for a different customer).  However, basepaws offered a free re-test which showed much better results.  So, that can happen, but I am guessing that is rare (and the more common issue is what I am describing in this blog post).  For example, when you look at my 2 lcWGS replicates (equivalent to a paid re-test), one is not really better than the other.  There is just a certain about of noise and limits to the methods (at least currently).

Part #3: Advanced Details:

With my ~15x cat genome data (along with my human data), I tested running imputation of down-sampled reads, which you can see here.  I am also plotting that below:


For reference, I don't have the raw lcWGS FASTQ data, but earlier versions of reports said that technical replicate #1 had 3,488,515 fragments and technical replicate #2 had 2,712,098 fragments.  For comparison, my regular coverage WGS sample had 166,490,724 paired-end reads (I think comparable to the "fragments" in those reports).

Because of the fragments smaller than the read length, my "regular" coverage WGS was closer to 15x than 20x.  I also don't know how many fragments are for lcWGS versus Amplicon-Seq in the "Breed + Health" results.  Nevertheless, I think the lcWGS "fragments" in those earlier reports roughly match an expectation of being 0.1x to 0.5x.

My main goal in the above plot was to test self identification.  With the same number of reads, the Gencove cat imputation worked a little worse for my cat's sample than my human sample (for either Gencove or open-source options for humans), but I don't think that is surprising because I think the human variation is better understood.  Nevertheless, if you follow the Gencove-cat trajectory, then I think there might be some benefits to having ~2x the fragment count (even though I would probably still not consider that to be equivalent to genotypes without imputation).  That said, to be fair, I don't know if some things (like broad ancestry groups) might be detectable with less precision than being able to self identify your own (cat's) sample.  Also, if a relative finder function is added, then Bastu's 2 lcWGS technical replicates can act as a positive control (to gauge how important this measure really was).

Likewise, I believe there is at least the Martin et al. 2021 paper emphasizing a noticeable advantage to using 4-6x WGS (over 0.5x WGS).  For example, there is a noticeable difference for the 0.5x results in Figure 4A (and as well as Table S4 and Table S5).  That is for certain populations, but it seems like that may match what I am seeing as well?

Perhaps most importantly, to give some more examples of selected problems on the human side, you can also see issues with the human lcWGS imputation here at the level of individual genotypes, which I think may be why Nebula now only provides regular/high coverage sequencing for customers.

basepaws uses Amplicon-Seq (not the lcWGS) for the health markers, so I believe those should be thought of as independent results (and the technical replicate discordance is not necessarily predictive of the concordance for the health markers).

My understanding is that basepaws is planning on adding Amplicon-Seq for trait markers in the future.  I think this will be added to the existing report for the "regular" coverage sequencing data.  However, customers will need to keep in mind this can't (or at least shouldn't) be added from the lcWGS.  My understanding is that the additional cost to add those extra Amplicon-Seq markers to previous reports will be minimal, but I think that is worth making clear new libraries need to be prepared to return those results.

It might not be the most important point, but I wanted to acknowledge that I believe what basepaws is doing with the chromosome painting is better than produced got for Bastu's sample with RFMix (which you can see here, for example, if you scroll towards the middle of the post).  However, I thought that was sufficiently far from being a reasonable result that I did not include that in my mini-report of re-analysis that I showed above.  I am also expressing similar concerns for the technical replicates above.

So, in the immediate future, I am not sure if doing something like the ADMIXTURE analysis used for the table and pie charts might help with giving robust results for those broad ancestry groups (which I think should also work with closely related cats, if you used something like plink kinship).  If there were any issued with defining relatedness with the chromosome painting results, then I think that that should be OK with enough reads for 1 genome-wide estimate (and I would rather have a close cat relative finder than a breed index/group that might cause confusion and may not be great at identifying breeds in new test samples, like what I have seen in the Facebook discussion group).  However, either way, that is the explanation for what I presented in my "mini-report" from re-analysis of raw "regular" coverage sequencing data.

Part #4: Acknowledgements:

I can't thank the other basepaws customers enough for their discussions, which have helped me sort through my thoughts.  I also hope that can continue in the future!

The basepaws staff has also provided responses to all of my e-mails.  For example, I think that is how I know the Breed Index/Group (which shouldn't be used to categorize purebred cats) comes from lcWGS and the health markers come from Amplicon-Seq (also verified here).  So, thank you for your helpful feedback, as well as encouraging a community were such discussion can take place!

P.S. I have some on-going notes about known traits (not currently in the basepaws report), but I would be happy to hear more.  This includes things like long hair.

In general, I tend to provide things like links to informational details from the UC-Davis VGL, but I am encouraging you to us the links on the informational page to purchase those separate tests.  For example, I purchased the UC-Davis "Cat Ancestry" panel that includes some trait markers as well the Optimal Selection panel (also mentioned in the earlier blog post).

If you are a breeder, I think part of the goal of Optimal Selection is to identify mating pairs with the maximal possible diversity within the breed.

Maybe it is otherwise a little off-topic, but I mention this because I think people purchasing the Breed + Health kit might in fact be interested in understanding some of the traits that they see in thier cat.

P.P.S. If a relative finder was added and both parents were in the basepaws database, then that would in fact be relevant for confirming that a cat is purebred (as long as there were no methodological issues, or especially low read coverage).  However, that is not currently offered from basepaws, so that is why I am saying that the current breed measures cannot be used to determine your cat's breed (as also said in the disclaimer from basepaws).

Change Log:

2/27/2021 - public post

2/28/2021 - minor changes (including switching wording from "Breed Index" to "Breed Group")

3/6/2021 - add notes for some other common questions and caveats + minor change

3/15/2021 - add lcWGS fragment counts (and linked image)

3/26/2021 - add note to make clear that all 3 reports were re-processed at the same time + add link to Martin et al. 2021 lcWGS paper

3/28/2021 - add extra details / minor re-organization; correct misunderstanding of table

4/18/2021 - add sentence about basepaws sample mix-up

11/21/2021 - add note about 2 markers defining "Lynx Point".

Sunday, March 8, 2020

Testing Limits of Self-Identification / Relatedness using Genomic FASTQ Files

Color asked me sign a HIPAA release in order to get access to raw genomic data, which included a FASTQ file with ~15,000 reads.  So, I thought it might be useful to get an idea about how few reads (from random low-coverage Whole Genome Sequencing) can be used to identify myself.

To be clear, I think most rules are meant to take possible future advances into consideration.  So, just because I can't identify myself, doesn't mean somebody else can't identify me with fewer reads (with current of future methods).  Nevertheless, if I can identify myself, then I think that there is a good chance others could probably identify themselves with a similar number of reads and/or variants (and possibly fewer reads/variants).

Down-Sampling 1000 Genomes Omni SNP Chip Data

I compared relatedness estimates for myself with the following genotypes:  1) Veritas WGS, 2) 23andMe SNP chip, 3) Genes for Good SNP chip, and 4) Nebula lcWGS (along with the matching positions from the 1000 Genomes Omni SNP chip).

Perhaps more importantly, I also show kinship/relationship estimates (from plink) for 1000 Genomes samples for parent-to-child relationships as well as more distant relationships:


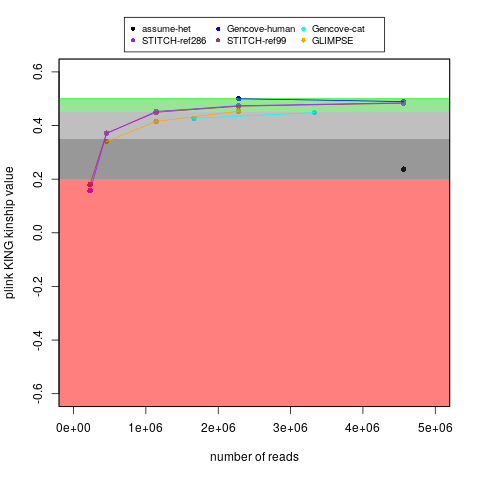
As you can see, there is a bit more variability in the parent-to-child estimates with a few thousand variants.  The self-identification estimates (among pairs of my 4 samples) were always greater than 0.45, but there is noticeable overlap in the kinship estimates for 1000 Genomes parent-to-child and more distant relatives when you drop down to only using 19 variants.

So, making sure you didn't get false positives for close relationships may be important, particularly with smaller numbers of variants.  If you have SNP chip or regular Whole Genome Sequencing data, then identifying yourself would also be easier than having 2 low-coverage Whole Genome Sequencing datasets.

However, if I can get 1000s (or perhaps even 100s) of variant calls, I am currently most interested in how accurate those calls can be.

Gencove and STITCH Imputed Self-Identification

I have earlier posts showing that the Gencove imputed variants from Nebula were not acceptable for individual variant calls, but I think they provided reasonable broad ancestry and relatedness results.  To be fair, I don't believe Nebula is currently providing low coverage Whole Genome Sequencing results anymore, opting for much higher coverage (like regular Whole Genome Sequencing).  However, Color provided me with considerably fewer lcWGS reads than Nebula (and Color also has a pre-print about lcWGS Polygenic Risk Scores that I was concerned about).

So, I was interested in testing what imputed variants I could get if I uploaded FASTQ files for Gencove analysis myself (as well as an open-source option called STITCH).


There is also more information about running STITCH (as well as more statistics for Gencove variant concordance) within this subfolder (and this subfolder/README) on the human GitHub page.  Essentially, the performance of the human lcWGS looks good at 0.1x (if not better than the earlier Gencove genotypes that were provided to me from Nebula), but there is a drop in performance with the cat lcWGS.

I ran the STITCH analysis on a local computer, so the run-time was longer than Gencove (between 1 day and 1 week, depending upon the number of reference samples - hence, I would start with running STITCH with ~99 reference samples in the future).  However, if you were willing to pay to run analysis on the cloud (or use more local computing power), I think the run-time would be more similar if each chromosome was analyzed in parallel.  Also, STITCH is open-source, and doesn't have any limits on the minimum or maximum number of reads that can be processed.  The performance also looks similar with ~5 million 100 bp paired-end reads, so the window for more accurate results that can be returned from Gencove may be around 2 million reads.  So, I think using STITCH can have advantages in a research setting.

I welcome alternative suggestions of (open-source) methods to try, but would tentatively come up with these suggestions (for 100 bp paired-end reads, with random / even coverage across the genome):

greater than 1 million reads: good chance of self-identification

0.1 - 1 million reads: intermediate chance of self-identification (perhaps similar to patient's initials, if it narrows down a set of family members?).  Potentially "good" chance of self-identification with other methods and/or future developments.

less than 0.1 million reads: respect general privacy and allow for future improvements, but additional challenges may be countered.  There still may also be sensitive and/or informative rare variants.

I also added the results for GLIMPSE lcWGS imputations (Rubinacci et al. 2020).  These are human results, but the performance was a little lower than STITCH (more similar to the Gencove results for my cat, but lower than the Gencove results for myself).  However, it probably should be noted that I did not specify my ancestry for GLIMPSE but I did specify a limited number of populations for STITCH.  So, if you don't know the  ancestry (or the ancestry used might  confound the results), then that loss of concordance may be  OK.  Also, I think the  GLIMPSE run-time was shorter (within 1 day) and it used the full set of 1000 Genomes samples as the reference set.

Recovery/Observation of Variants in 1 Read

Even if I don't exactly know what is most likely to be able to self-identify myself, I can try to get some idea of the best-case scenario in terms of even having 1x coverage at a potentially informative variant position.

The numbers here are a little different than the 1st section: I am looking for places where my genome varies from the reference genome, and I am considering a larger number of sites.  Nevertheless, I was curious about roughly how many reads it took to recover 500 or 1000 variants from a couple variant lists:


Notice the wide range of any SNPs that can be recovered versus a set of potentially informative SNPs.  However, it looks like you may very roughly notice problems with self-identification (for even future methods) with less than ~250,000 reads (matching the STITCH results above).  This is noticeably more than the ~15,000 of reads that I had to sign a HIPAA release to get from Color, but that lower limit (for any SNPs, called "WGS SNPs" with the gray line) was ~15,000 reads (very similar to what I was provided from Color, albeit single-end instead of paired-end).

In reality, you have sequencing error and a false discovery rate to consider when calling variants from 1 read, the nucleotide distribution at each position is not random between the 4 nucleotides, linkage (non-independence) of variants, and you have 2 copies of chromosomes for each position in the genome reference.  However, if you over-simplified things and asked how many combinations of 4 nucleotides (or even 2 nucleotides) create more unique sequences than the world population, that is noticeably less than the 500 or 1000 thresholds added to the plot above.

So, if you consider rare SNPs (instead of calculating a relatedness estimate, with common SNPs), perhaps you could identify yourself with less than 50,000 reads?  Either way, if you give some rough estimate allowing for future improvements in technology, I would feel safe exercising extra caution with data that has at least 100,000 reads (collected randomly / evenly across the genome).  I also believe that erring on the side of caution for data with fewer reads is probably wise as a preventative measure, but I think the possible applications for that data is lower.

Closing Thoughts

If anybody has knowledge of any other strategies, I am interested in hearing about them.  For example, I think there may be something relevant from Gilly et al. 2019, but I don't currently have a 3rd imputation benchmark set up.  I have also tried to ask a similar question on this Biostars discussion, since it looks like Gencove is no longer freely available (even though I was able to conduct the analysis above using a free trial).  I have all of this data publicly available on my Personal Genome Project page.

I am also not saying that it is not important to consider privacy for samples with less than any of the numbers of reads that I mention above (with or without a way to self-identify myself with current methods).  For example, the FASTQ files have information about the machine, run, and barcode in them (even with only 1 read).  So, if the consumer genomics company had a map between samples and customers, then perhaps that is worth keeping in mind for privacy conversations.  Likewise, if the smaller number of variants includes disease-related variants, perhaps that is also worth considering.

I don't want to cause unnecessary alarm: as mentioned above, I have made my own data public.  However, you do have to take the type of consent into consideration when working with FASTQ files (for data deposit and data sharing).  For example, you currently need "explicit consent" for either public or controlled access of samples collected after January 25th, 2015.

Finally, I would like to thank Robert Davies for the assistance that he provided (in terms of talking about the general idea, as well as attempting to use STITCH for genotype annotations), which you can see from this GitHub discussion.  I would also like to thank several individuals for helping me learn more about the consent requirements for data deposit.

Additional References

I am interested to hear feedback from others, potentially including expansion of this list.

However, if it might help with discussion, here are some possibly useful references:

Selected Genomic Identifiability Studies (or at least relevant publications):
  • Sholl et al. 2016 - Supplemental Methods describe using 48 SNPs to "confirm patient identity and eliminate sample mix-up and cross-contamination".
  • McGuire et al. 2008 - article describing genomics and privacy with some emphasis on medical records
  • Oestreich et al. 2021 - article generally discussing genomics identifiability and privacy
  • Ziegenhain and Sandberg 2021 - in theory, considers methodology to provide anonymized processed data.  I have not tried this myself, but this could at best maximize downstream analysis.  That might be useful in that it expands processed data that could be shared with caveats.  However, some things require accurate sequencing reads as unaltered raw data.  Modified sequences should not be represented as such "raw" data.
  • Wan et al. 2022 - article generally discussing genomics identifiability and privacy
  • Russell et al. 2022 - instead of sequencing coverage (such as in this blog post), this preprint describes the impact of the amount of starting DNA material on microarray genotyping for forensics analysis.
    • Kim and Rosenberg 2022 - preprint describing characteristics affecting identifiability for STR (Short Tandem Repeat) analysis
  • Popli et al. 2022 - a preprint describing kinship estimates in low coverage sequencing data (and the amount of data for relatedness estimates is the topic for most of the content in this blog post)
While related to the more general topic, I think the goals of Lippert et al. 2017 and Venkatesaramani et al. 2021 and are somewhat different than what I was trying to compare (including image analysis).

I also have some notes in this blog post, some of which are from peer reviewed publications and some from other sources (such as NIH and HHS website).  Again, I would certainly like to learn more.

In addition to the publications for STITCH/GLIMPSE/Gencove, other imputation / low-coverage analysis studies include Martin et al. 2021, Emde et al. 2021 and GLIMPSE2.  Hanks et al. 2022 also compares microarray genotyping and low coverage imputation to Whole Genome sequencing.  If it expected that low coverage analysis includes enough markers to be useful, then I think you are either directly or indirectly saying that level of coverage is sufficient to identify the individual (which I think is a criteria that is likely easier to meet than clinical utility).

I certainly don't want to cause any undue concern.  I think some public data is important for the scientific community, but I think it is appropriate for most individuals to agree to controlled access data sharing.  Nevertheless, I think this is an important topic, which might need additional communication in the scientific community.

Change Log:

3/8/2020 - public post
3/9/2020 - add comment about simplified unique sequence calculation
4/8/2020 - add STITCH results + minor changes
4/9/2020 - minor changes
4/16/2020 - minor change
5/1/2020 - add link for GLIMPSE (before analysis)
7/28/2020 - add GLIMPSE results
1/15/2023 - add additional references for other studies
3/16/2023 - add 48 SNP verification
 
Creative Commons License
Charles Warden's Science Blog by Charles Warden is licensed under a Creative Commons Attribution-NonCommercial-NoDerivs 3.0 United States License.