Showing posts with label 23andMe. Show all posts

Thursday, December 5, 2019

PRS Results from my Genomics Data (mostly from impute.me)

I haven't had a whole lot of personal experience with Polygenic Risk Score (PRS) estimates, so I thought it was interesting when I found a couple options for re-analysis of my own genomics data (for selected examples):

Association SNP chip
(impute.me)

(Folkersen et al. 2020)
Other
Re-Analysis Options
23andMe Results
Type 2 Diabetes
(No)
(Type 2 Diabetes, 146 variants)

Average / Above Average
(23andMe-V3, 12/19)

Average / Above Average
(AncestryDNA, 12/19)
MySeq

1.000 risk ratio [error]
(Nebula lcWGS)

0.955 risk ratio
(Genos Exome, 3 variants)

1.089 risk ratio
(Veritas WGS, 6 variants)
"Typical Risk" of 23% (directly from 23andMe, PRS with 1,244 loci)
[actually, slightly lower than normal]

Reduces to less than 1% when age, height, weight, fast food consumption, and exercise rate are taken into consideration (also from 23andMe)
Ulcerative Colitis
(once, so I think really "no")
(23 variants, and 116 variants)

Both Below Average and Above Average Risk, for different PRS
(23andMe-V3, 12/19)

Both Below Average and Above Average Risk, for different PRS
(AncestryDNA, 12/19)
Anxiety Disorder
(Yes, but getting better)
(6 variants)

Average / Above Average
(23andMe-V3, 12/19)

Average / Above Average
(AncestryDNA, 12/19)
Migraine
(Periodic)
(26 variants, and 21 variants)

2 PRS (Average and Above Average)
(23andMe-V3, 12/19)

2 PRS (Average and Above Average)
(AncestryDNA, 12/19)
Eye Color
(Light Brown)
DNA.land

Likely to have Brown Eyes
(23andMe-V3, 12/19)

Likely to have Brown Eyes
(23andMe-V3_V5, 12/19)

Likely to have Brown Eyes
(AncestryDNA, 12/19)
23andMe reports that I am expected to have "brown or hazel eyes" based upon 1 SNP (rs12913832)
Hair Color
(Light Brown)
See Below

(Roughly 25% Red and 50% Blonde)
For "Light or Dark Hair", 23andMe reports that I have "Likely Dark" Hair (using 42 SNPs)

For "Red Hair" 23andMe reports that I am "Unlikely to have red hair" (using 3 MC1R SNPs: rs1805007, rs1805008, and another custom MCR1 probe)
Height
(180 cm)
See Below DNA.land

171 cm: "Likely Taller than Average"
(23andMe-V3, 12/19)

171 cm: "Likely Taller than Average"
(23andMe-V3_V5, 12/19)

171 cm: "Likely Taller than Average"
(AncestryDNA, 12/19)

Individual SNP risks were reported (from impute.me).  While I had a bit of a hard time finding the precise overall risk estimate (without trying to sum / multiply separate risks), this might be OK in terms of getting a sense of whether I was an outlier or not.  For example, being above or below average for "Type 2 Diabetes" seemed to vary (unless you say most people were under something like a null distribution for "average" risk).  In other words, I thought the following plots (which you could see for various traits) were interesting:

impute.me Type 2 Diabetes PRS (23andMe V3)


impute.me Ulcerative Colitis (1st entry, 23andMe V3)


impute.me Ulcerative Colitis (2nd entry, 23andMe V3)

impute.me Anxiety Disorder PRS (23andMe V3)

impute.me Migraine-Broad PRS (23andMe V3)


impute.me Migraine PRS (23andMe V3)

impute.me Hair Color (23andMe V3 + Ancestry DNA, respectively)


impute.me Height (23andMe V3)


I thought the anxiety disorder result was interesting for 2 reasons.  First, I have had issues with anxiety problems (for example, you can click here for notes, even though they are primarily related to PatientsLikeMe).  Second, notice the environmental component is larger than the genetics component.  This matches my concerns that I expressed in this review of "blueprint".  For example, I would say the predictive power from birth has some notable limitations (such as difficulties in the need to take medication at any given point in your life).

While I am not sure if the exact right term was used (since I thought "Ulcerative Colitis" was a condition, rather than a symptom).  However, I was hospitalized for Ulcerative Colitis (even though that was a one time occurrence caused from E. coli with Shiga toxin).

I also get migraines.

I don't have Type 2 Diabetes, but I provided that because I also had other PRS results to compare.  Similarly, if others have suggestions where I can quickly compare to the impute.me PRS results, please let me know and I would be very happy to add them!

For example, I did add DNA.land (and 23andMe) Eye Color and Height based upon a Twitter response.  While I think height is one of the more heritable traits, DNA.land couldn't guess my actual height within a few inches (and there is a noticeable spread of points for the impute.me plot above).  Even though DNA.land gave lower confidence to other predictions, I would say these have been "fair" rather than "high" confidence (and everything else probably should have been "low" confidence).  I am close to the diagonal for the impute.me plot, but I don't know if the scale is 1:1.  For example, my DNA.land height prediction was off by 3-4 inches.  However, to be fair, note that the highest and lowest percentiles for high don't have overlap (there are not any points in the upper-left or bottom-right regions of the scatter plot, even though those make up a smaller fraction of the population).

For comparison, here is the distribution of score for DNA.land (where my true height was greater than anything on the density distribution - perhaps because this was height scaled for female percentiles?):


For impute.me, the predicted hair color shows blondness on the x-axis and redness on the y-axis.  The cyan circle is my actual color (which I filled in), and the while circle is my predicted color.  I think my hair color used to be lighter than it is now (and I think the shade that I reported for myself was a bit too dark), so that is closer to the genetic prediction (perhaps half-way between).

It may be worth noting that 23andMe could predict that I had brown hair and eyes (although I think that covers most people and you need the more rare traits to better calculate accuracy - for example, Francis Collins said that his 23andMe report indicated he had brown eyes when he really had blue eyes, at least 10 years ago).

Again, for comparison, here is the distribution of DNA.land scores for eye color:


I didn't add the AncestryDNA density plots since they looked qualitatively similar to the 23andMe V3 plots (and, on another computer, I had an issue with the percent variance explained appearing in a pie chart that was harder to read).  I also originally intended to test my updated 23andMe genotypes (V3+V5), but I got an error saying that data was already uploaded (from my V3 chip).  However, perhaps I can test those results later, and see if they are still similar.

With a $5 donation, the turn-around time for processing was 1-3 days.

For Genos Exome and Veritas WGS data, I used the BWA-MEM Re-Aligned GATK Variant calls.  However, I think the main conclusion from looking at my diabetes results was that I was of average risk, and I don't believe my own genetic diabetes PRS risk assessment was great without taking additional factors into consideration (for 23andMe, that was a difference between 23% and 1%, after considering BMI, diet, and exercise).

This essentially matches Supplementary Figure S12 for this paper (whose title I respectfully believe can give the reader the wrong impression, and there is at least one objective error that I believe needs to be corrected), where absolute risk explained was usually very low (usually explaining less than 15% of the variation for a trait).  You can also see that the variability explained by "this score" for the impute.me PRS above is estimated to be less than half of the genetic component.

I think the preprint by Brockman et al. 2021 might also have some additional relevant information for this discussion.

In somewhat different contexts, you can also see some notes / concerns about percentiles / indices in the posts on Nebula and basepaws lcWGS results.

Change Log:

12/5/2019 - public post
12/7/2019 - add DNA.land results based upon Twitter reply from Debbie Kennett; revise wording in post
12/8/2019 - mention possible scaling for female height; also fix date for previous log entry.
6/25/2020 - add links to posts with Nebula and basepaws results.  Minor formatting changes.
7/7/2020 - add reference to impute.me paper
4/22/2021 - add reference to another paper
2/4/2024 - change column labels to be more precise

Monday, September 16, 2019

Examples of Visual Critical Assessment for Ancestry Chromosome Painting

[this post is a collection of images to try and make my points from this Twitter discussion more clear]

NOTE: After creating this blog post, I created this Biostars discussion.  I think this is a little shorter and perhaps a better format for discussion.  So, you can want to consider looking at that discussion instead of (or in addition to) this post.  Thank you very much for your interest.

As also mentioned in this other post, my African ancestry (whether that is what most people would consider to be African, or ancestors that migrated out of Africa relatively more recently) should come from my father's side.

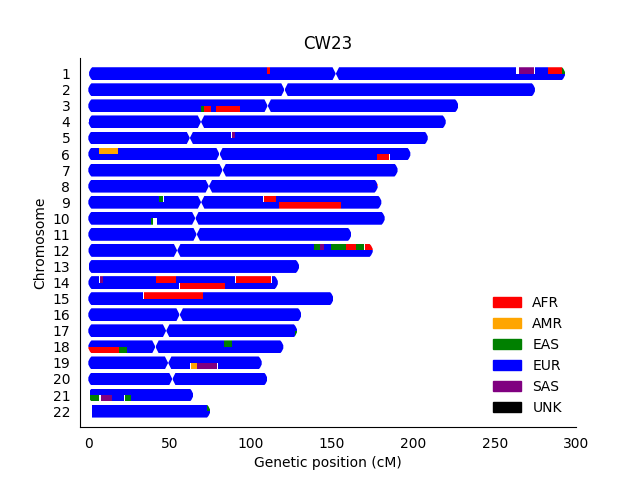
While upstream phasing by SHAPEIT can also be a factor, I did some RFMix re-analysis with various data types, including the result below:


Assuming that each row represents a chromosome that I inherited from each parent, the most clear problem is that the African (AFR red ancestry) should really only be on one copy of chromosome 14 (and I assume the adjacent European EUR segments are not precise, and there should really be one larger segment).

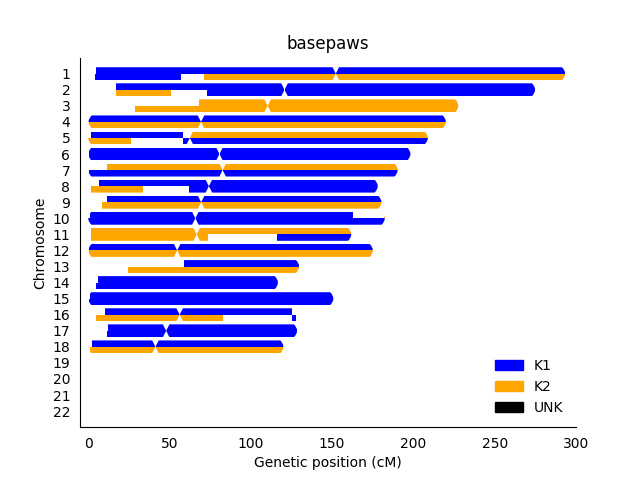
While I am not entirely certain about the underlying method, there is also an example where I think visual inspection can be useful for a result from basepaws.  While my notes are messy (and sometimes incomplete), you can look here for more information (if desired).  I purchased ~15x Whole Genome Sequencing for $1000 (to get raw data), rather than the more typical $95 for low coverage Whole Genome Sequencing (lcWGS) and Amplicon-Seq for health markers.

So, I don't exactly have my own basepaws report, but I think there is a fairly new version of broad ancestry assignments (via chromosome painting) that can be viewed on page 3 of this PDF (for another cat).  In terms of separate images that I can find on-line, this blog post with an earlier report (again, for another cat) has ancestry painting, but it doesn't have the same problem.  Likewise, the chromosome painting plot on this blog post doesn't have the same issue.

So, I will just verbally say that the cat chromosome painting on on page 3 of this PDF looks off in that the broad ancestry assignments seem to be the same on both copies of each chromosome.  To be fair, they aren't always the same (which is good - I think the ancestry for most cats should probably be relatively independent for each chromosome copy).

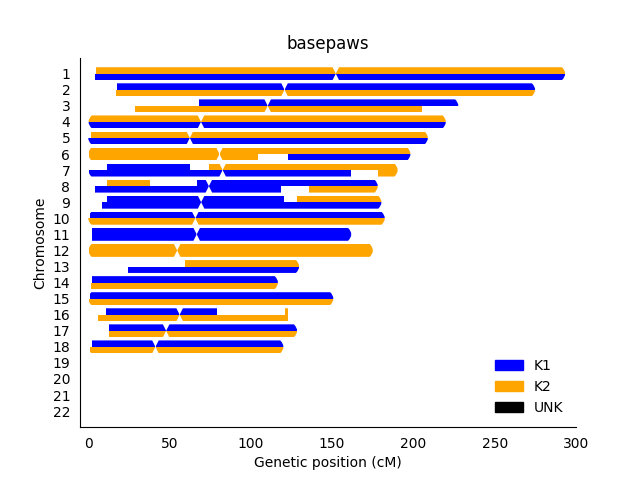
However, in terms of giving advice for troubleshooting, I can also show you my attempted RFMix analysis (which clearly has problems, and I wouldn't recommend for returning as a result for anybody else).


Now, the chromosome copies do show more independent ancestry (per chromosome copy), but the results are not reproducible.  However, in that particular context (performing re-analysis of my cat's data), I thought ADMIXURE and PCA (using public reference samples) did have reasonable results.  So, I think there were other strategies (which I would probably consider "simpler" strategies that I thought did give reasonable results), which is good and important.  While there may be a problem in the assumption of use for some more specific breeds (such a single markers for the Scottish Fold or Sphynx), my point is that I consider the ADMIXTURE and PCA results to be OK for the broader ancestry (meaning I think there is some sort of robust ancestry result that can be provided for cats).

Nevertheless, the overall goal was to be able to visually identify likely problems with inheritance (and/or limitations to precision for ancestry results), and I think the above plots are OK for that.

That said, even this troubleshooting should probably be thought of as "hypothesis generation."  In other words, if your first assumption when seeing results like I have shown above is not "Something looks like it could / likely is wrong," then I think this is helpful in terms of needing to critically assess genomics results.  However, it is also important that you then try to think of ways to identify the more specific problem.  While phasing may be an issue with the human 23andMe results and the more limited number of probes / markers for the public reference samples is my expected problem with the basepaws cat RFMix analysis, you generally gain confidence in a result when you keep trying find a problem (and you keep finding valid explanations for the results).  So, in some ways, it may be best to call my critique a "hypothesis."  For example, saying I couldn't get reasonable RFMix results for my cat analysis (and I should also admit that there could also be some sort of bug that I haven't been able to find) is not the same of saying some sort of chromosome painting analysis is not possible in the future (as long as the underlying biological assumption is valid).

Change Log:

9/16/2019 - public post date
2/6/2020 - add Biostars discussion link

Saturday, August 10, 2019

Disqus / Twitter Follow-Up: Comparing My 23andMe SNP Chip Concordance with Different Veritas WGS files

I am mostly summarizing my points from the following Twitter discussion:

https://twitter.com/carolinefwright/status/1157219572514209792

The original intention was to add this as a comment in the Disqus comment in the original pre-print discussion.  However, I thought this was fairly long, and I wanted to be able to have a little more control over figure formatting.

For reference, I recommended taking a look at Illumina arrays in an earlier comment, and I mentioned there there are datasets with both 23andMe SNP chip data and high-throughput sequencing data (like myself).

As a success story, that comment was followed up on, and new data was added.  In particular, there was a plot of the error/discordance rate between my own 23andMe data and my Veritas WGS data posted on Twitter.

I think this is great, but I think it may be worth emphasizing that re-processing my Veritas WGS data resulted in better concordance with my Exome data.  Additionally, I have an upgraded V5 chip, so there are actually 2 sets of 23andMe Data (although almost all of these results are based upon my later set of V3_V5 genotypes).

Nevertheless, I actually have 2 .vcf files for my Veritas WGS data (the provided .vcf, and the .vcf that I produced from extracted FASTQ files and reprocessed using BWA-MEM and GATK).

I did some analysis with my V3 23andMe genotypes, but I think that was mostly consistent with my V3_V5 genotypes.  Among probes on both arrays, there were only 5 discordant sites (so, I think that is how the previously lower error rate was reported: SNP chip versus same SNP chip, instead of SNP chip versus WGS).

In contrast, even the best-case scenario for my data seems to have concordance of 97.6-99.2% (with MAF > 0.01 variants), and this was slightly lower for the V3_V5 genotypes.  If I only considered my original V3 genotypes, this would have been better than I had previously reported for my Exome versus WGS data (98-99% for BWA-MEM + GATK re-processed variants).  However, either way, there are over a million probes on the V5 23andMe array.  So, I think something about variants being used for “research purposes” may be relevant (although I will show below that certain sets of variants do have higher reproducibility).

The trends can vary depending upon what I use for the MAF calculation:

1000 Genomes:


gnomAD:


Kaviar:


I am showing 2 plots each because I have 2 .vcf files for my WGS data (the one provided by Veritas, and the BWA-MEM + GATK re-processed variant file).  While the results are above are mostly similar with either Veritas WGS .vcf, there are some noticeable differences in the exact set of rare variants with different population estimates (which could either be because of the composition of individuals, or with the different sample processing strategies for each project).

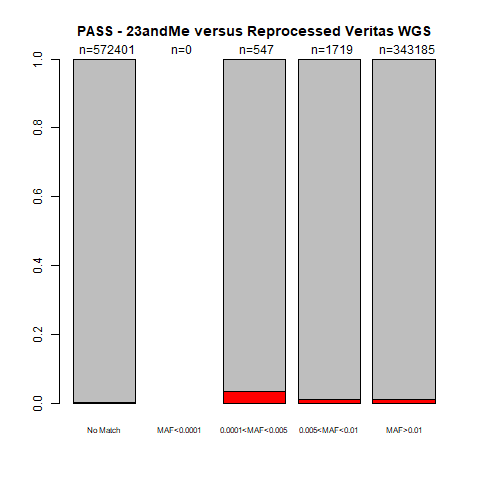
When I converted my 23andMe to VCF format, I added a “PASS” status (to keep track of variants within repeats, for example).  If there was no other note, the variant had a “PASS” in the FILTER column.  If I only consider “PASS” variants, this is what those plots look like:

1000 Genomes:


gnomAD:


Kaviar:


If I only consider the “PASS” variants, the accuracy also increases a little (from 98.8-99.7% for my initial V3 genotypes, and 98.009-99.997% with the range of MAF for my V3_V5 genotypes), usually in the far-left column.

Finally, if I start from the full set of variants, but I only look at those that were discordant between my WGS .vcf files, I see better concordance for re-processed variants if they are common (but the trend for the smaller variant sets can vary):

1000 Genomes:


gnomAD:


Kaviar:


For these plots, the largest number of variants are in the far-right column.  Since that far-right column usually has less SNP chip discordance (less red in the barplot), that is consistent with my earlier conclusion that re-processing the WGS data could produce variants with higher overall concordance (in that situation, between Exome and WGS data).  However, this can clearly vary between individual variants/positions (and the best processing strategy may vary depending upon where you need to be calling variants).

I can't really visualize the SNP chip data, and I kind of have to trust the "NC" status for "No Call" positions (and I don't have access to a more raw form of data, like the intensities).

However, as a general rule, I would always recommend checking your alignments for false negatives or false positives (which you can do with a free genome browser like IGV).  I added some ClinVar annotations to try and find some discordant sites to check, and I've listed a couple below:

1) I was surprised that my re-processed was missing my cystic fibrosis variant (which I have a whole other post about).  However, this was purely a formatting issue.

Namely, I threw out most indel positions (indicated by DI) because figuring out exactly what that represents is more difficult than for the SNPs.  However, with my earlier V3 chip analysis, I manually converted some indels in my code (including my cystic fibrosis indel).  However, I converted to match the freebayes indel format in the provided .vcf for the .

In the other blog post, you can clearly see that I am a cystic fibrosis carrier, even with the re-alignment.  So, I looked up the GATK format for that indel and checked the status of that variant.  Indeed, I do have a variant call for chr7 117149181 . CTT C.  So, this is in fact OK (as long as the annotation software can figure out I have the variant, which I think was part of the problem described in the other blog post).

2) While it wasn't a discordant site between .vcf files, there were only a limited number of total ClinVar pathogenic variants.  So, I happened to notice one that indicated I was homozygous for the pathogenic variant in my 23andMe data (1/1) but a variant was not called at that position with either of the Veritas WGS .vcf files (indicated by a 0/0 in the genotype columns).  In other words, the SNP chip data was consistent with a SNP chip replicate, the WGS variant was robust different processing methods, but the result was different for SNP chip versus WGS.

However, I can check the alignments for both the provided and reprocessed WGS data (as well as provided and reprocessed Exome data), which is what I do below:


The plot above shows alignments in the following order (top to bottom): Genos Exome Provided, Genos Exome Reprocessed, Veritas WGS Provided, Veritas WGS Reprocessed

So, from the alignments, I would be inclined to agree with the WGS variant calls.  If there is some isoform of the gene that is so far diverged the reads wouldn't align, that could be an exception.  However, I don't think that situation would be best described as a SNP.  Also, I don't believe any reports indicated that I had predisposition to Neurofibromatosis (and I don't know anybody in my family that was diagnosed with that disease).  This was a custom 23andMe probe (labeled as i5003284, instead of a typical rsID).  However, the larger ANNOVAR annotation file has the ClinVar information, and I can find a dbSNP ID using the UCSC Genome Browser (for hg19, chr17:29541542).  So, in terms of checking the ANNOVAR annotation, if I actually did have two copies of an NF1 pathogenic variant, rs137854557 does have multiple reports indicating it being pathogenic (less of a confident assertion than my cystic fibrosis variant, but more than most of my other "pathogenic" variants).

As a final note, the data and code for analysis of my V3_V5 23andMe genotype data (and 2 Veritas WGS .vcf files) is available here.

Update Log:

8/10/2019 - public post date
1/15/2020 - add tag for "Converted Twitter Response"

Sunday, August 4, 2019

Digging Deeper into my Cystic Fibrosis Carrier Status

One overall goal from the various subfolders on the DTC_Scripts repository was to get an idea about how much the data / results could vary between vendors.

I suppose some people might consider it surprising that the "raw" genotypes/variants could vary, but I previously discussed that in a post about re-processing raw data to get more concordant genotypes (and I also have a post about tools to make HLA assignments among this collection of posts).

Some things, like ancestry, may arguably fall under what I would call "hypothesis generation" results, in that some results may be more robust than others (and limitations to the accuracy of specific ancestry assignments are described in another post).

In contrast, this post focuses on something that I think can be utilized with relatively greater confidence (that I am a cystic fibrosis carrier).

That said, in an sense, making sure you get single-gene, rare-disease genomics analysis consistently correct is more complicated than you might expect.  However, in terms of being confident about any genomics result, I think rare variants associated with Mendelian diseases should be a strong point for genomics benefiting society.

So, here is the outline of what happened:


  • In 2011, I was genotyped (with the V3 chip) by 23andMe 
    • This indicated that I was a cystic fibrosis carrier
  • While some carrier status results have been removed (and added back in), I knew my carrier status before there were any issues with the FDA.
  • In 2016, I got Veritas Whole Genome Sequencing raw data (and a GET-Evidence and ClinVar report from the Personal Genome Project)
  • In 2017, I got Genos Exome raw data with an automated report
    • Update (3/17/2020): When I currently sign into the Genos browser, I see my pathogenic variant annotation in the CFTR gene.  I am not sure when/if this was changed, but the report does now successfully show multiple references that are correct for my cystic fibrosis carrier status.
  • In 2019, I ordered a bunch of extra tests (primarily emphasizing the interpretation over the raw data), but this included Helix Exome+ data from the Mayo GeneGuide (the raw data cost extra, and was a gVCF).
  • So, I had 3 high-throughput sequencing results that covered my cystic fibrosis variant.  However, none of them indicated that I was cystic fibrosis carrier in a way that was immediately obvious, and I think at least one (Mayo GeneGuide) failed to report my cystic fibrosis status (even when covering a smaller number of diseases).
    • You can see my FDA MedWatch / MAUDE report for Mayo GeneGuide in MW5093889.  Helix sent me an e-mail that Mayo GeneGuide was discontinued on 4/30/2020, which you can also see on this website.
    • There are some extra formatting changes that I wasn't expecting, but you can also see my FDA MedWatch / MAUDE report for Veritas Genetics in MW5093888.  That said, I was describing my Personal Genome Project report (since I ordered the sequencing through the PGP) and I don't think Veritas specifically marketed annotating my cystic fibrosis status.  So, it might be OK if it is harder to find this report for Veritas Genetics through the search function.
    • I was particularly surprised by this for GeneGuide, since they limited the number of diseases they officially tested for (which I think was a good idea).  However, their guidelines for defining a pathogenic variant didn't include the variant covered by the 23andMe array.
    • It might also be worth mentioning that an on-line physician signed off of these other 3 results, but that didn't improve the accuracy of my cystic fibrosis carrier status.
  • With the 23andMe result, I could check the details of the variant they used to define me as carrier.  Namely, I could verify my carrier status for rs121908769 in ClinVar.
  • I might be forgetting the exact order of events after that.  However, the following gave me extra confidence that my earliest 23andMe result was in fact the "correct" one.
    • I could visualize my alignment in IGV (for my Veritas WGS and Genos Exome data) to see that I did in fact carry the variant (see below).
    • While a lot less intuitive to visualize, the Helix Exome+ data (which I had to pay extra for, beyond my GeneGuide results) also indicated that I had the variant in question, and IGV does accept a gVCF as an input file (see further below, under the .bam visualization).
    • I used the above data in response to a question on Biostars, I was particularly pleased to discover that I got feedback that helped me gain confidence in my own result.
      • For example, I learned about a website called CFTR2, which provides information unique to cystic fibrosis and the CFTR gene.
      • Specifically, this specialized website indicated that my 394delTT variant should be considered pathogenic for cystic fibrosis (if you have two pathogenic alleles).  Please note that you have to check usage agreement to view the specific result linked above.
      • I also discovered some formatting issues that I believe was responsible for at least one false negative.
    • In other words, all 4 results correctly indicated that I had the variant.  The only issue was with interpretation of that variant (which was "correct" for 1 out of 4 results). 
    • I thought I talked to multiple genetic counselors, but my GeneGuide notes indicate that the genetic counselor from PWNhealth agreed that the above information indicates that I was a cystic fibrosis carrier (even though I believe they were providing guidance for a result that more formally incorrectly indicated that I was not a carrier).

Veritas WGS /  Genos Exome BAM (Provided + BWA-MEM Re-Alignment)


Helix Exome +  / Mayo GeneGuide (gVCF)


In many ways, I still consider this a positive experience.  For example, note the following:


  • Having access to raw data allowed me to determine something that was incorrect / missing in my original report (and I think this should essentially be required)
    • That said, I hope the screenshots above show that FASTQ+BAM+VCF is probably a better format to require providing, rather than gVCF
  • Notice, I got free feedback in a public community forum (Biostars) that helped provide me information that I didn't obtain from any of the companies that I paid for genotyping / sequencing.  This emphasizes the value in having free options for re-analysis / re-processing of your data.
  • While it might require some additional training, sometimes simply viewing your data in IGV (a free genome browser) may be helpful for genetic counselors to assess the accuracy of individual genotypes.
    • While it makes life more difficult, the majority vote (3/4 companies, if you count as I did above) would actually be the wrong answer (falsely indicating that I as not a cystic fibrosis carrier).  So, kind of like I can tell that I need to work on fewer projects more in-depth, I think it probably helps to have specialization for genetic counselors (so, they can have an idea about what questions to ask, beyond what is provided in a short report).
  • I successfully learned (somewhat) more in-depth about a carrier status that could impact offspring (if my partner was also a carrier).  If planning to have a child should be decided on the scale of years (or you are assessing life-time risk for diseases with onset later in life), then taking some time to understand your genome on the scale of years may be OK (although, if you use IVF+PGT, you do need to make sure that the pre-defined variants are missing with high accuracy, on a shorter time-scale)


That said, I do think it is important to have realistic expectations about what can be done in genomics, and the need to spend a non-trivial amount of time sorting out the details for your area of expertise.

Update Log:

8/4/2019 - public post date
8/5/2019 - minor changes
8/6/2019 - minor changes
8/14/2019 - minor changes
8/15/2019 - minor changes
8/16/2019 - add link to IGV
3/17/2020 - list my ability to find CFTR pathogenic variant from Genos
4/24/2020 - add link to FDA MedWatch report (Helix + Mayo GeneGuide)
4/30/2020 - add link for Helix discontinuing Mayo GeneGuide
5/4/2020 - add link to FDA MedWatch report (Veritas Genetics)

My Genome-wide, Broad-Level Super-Population Ancestry was Robust, but I Observed Some False Positives in Smaller or Specific Segments

You can get an idea of the specific (country) assignments for ancestry in the various sub-folders on GitHub as well as sometimes in reports that I uploaded to my personal genome project page.

First, the good news: most companies indicate that I am mostly of European Ancestry, which is correct.

Second, the mixed news: while there were some findings that were correct, I had concerns about emphasizing a non-trivial false positive rate for some of the more specific ancestry predictions.  For example, I respectfully believe it is inappropriate for 23andMe to encourage travel destinations based upon their ancestry results.

To some extent, the names themselves sometimes indicate a limit to precision.  For example, if the category is "British & Irish" or "French & German," then you already don't have 1 country for a travel recommendation.  While I do have both British and Irish ancestry (and accordingly, those have the best specific marker evidence), I am a little concerned about the basis of some of the more specific assignments that I currently see.  For example, does overall population affect the density of likeihood that I had relatives from London?  If so, I think that would be kind of like assuming I live in either LA or NYC because I am from the United States (technically, I do live in the greater LA area, but I was born in Cincinnati and raised in Atlanta - plus, I think this is probably sufficient to make my point).  Also, it looks like that density plot is somewhat contradictory with the marker status, even within 23andMe.

While this sort of thing may be hard to firmly prove (for example, convergence between companies does not necessarily indicate the result is accurate, which we saw in a different way for my cystic fibrosis result), I have examples of the sort of things which I did or did not consider to be accurate below.

While some of these could be correct, I think it may sometimes be best to think of them like "hypotheses".

Positive Examples of More Specific (Relatively Recent) Ancestry


  • AncestryDNA predicted that I had more recent relatives in Tennessee, which is correct (on my mother's side).  However, even that may have had some limits to precision, given that the 1925-1950 interval seems less relevant to what I know.
  • 23andMe predicted that I had relatives living in Kingston Parish less than 200 years ago.  This could be correct.  Based upon my other family members, I can tell that this comes from my father's side with a relatively robust prediction of ~2-3% African ancestry (with large segments on multiple chromosomes).
    • I thought I had heard that my Great-Great-Grandfather (my Grandfather's Grandfather) was supposed to have been born from family that moved from the Caribbean to the United States (but I don't currently have confirmation of that).  
    • I also have consistent reports of Y-chromosome lineage E-M123.  While I am not sure if that is completely consistent with what I have described above, the greater African ancestry could be coming from Great-Great-Grandfather's father's mother's side (and/or his mother's side).


Effect of Filtering 23andMe Ancestry for Results with Higher Confidence Threshold


  • While I believe the above explanation for my African ancestry is plausible, there were 2 other specific ancestry predictions that I didn't think were right (and, in fact, those could be filtered by increasing the confidence threshold to 90%)
23andMe V3 Chip Ancestry Results (3/21/2019, 50% Confidence)

23andMe V3 Chip Ancestry Results (3/21/2019, 90% Confidence)

As noted in the GitHub notes, the East Asian & Native American and South Asian results go away with the higher confidence threshold (90%, instead of the default 50%).

What is not as clear from the above plots is that I also have notes of my percent Scandinavian ancestry varying from 11% to 3% (both with the V3 chip, at various times), and this is something that I think should have been called "Broadly European" instead of being assigned to a country that I believe is incorrect).  Accordingly, my Scandinavian ancestry also disappears if I change the confidence interval.  For other 23andMe customers, note the pull-down in the upper-right of the above screenshots.  That is how you can get the more conservative predictions (even though, in my opinion, I think it should be the other way around, where you have to opt-in for more speculative results).

I can also perform chromosome painting re-analysis with RFMix with 1000 Genomes reference samples, which I have shown below:


The overall picture is still that I am of mostly European ancestry.  You now start to get some small SAS (South Asian) predictions, but I think this is consistent with my general suggestion that the smaller segments are more likely to be false positives.

Also, all the segments of African ancestry should be coming from my father's side.  So, even though I think the above plot is good for some sense of overall estimates (for large segments), there is some sort of issue with phasing for my large SHAPEIT/RFMix chr14 segments (all the red should be 1 of my 2 copies of Chromosome 14, similar to my 23andMe results).  However, to be fair, there are chromosome-discordant 50% confidence results in my 23andMe data (with the smaller segments on Chromosome 3), which are on the same chromosome for this particular SHAPEIT/RFMix result (although that may also vary with different random seeds on different days).

Going back to the official 23andMe results, I purchased an upgraded V5 chip, and you can see those results below.

23andMe V5 Chip Ancestry Results (7/11/2019, 50% Confidence)

23andMe V5 Chip Ancestry Results (7/11/2019, 90% Confidence)


You now get a East Asian and Native American segment that remains with the higher confidence threshold.  However, using the same rationale as the SAS RFMix segments, I think the 0.1% segment on chr3 (surrounded by regions that were filtered with the higher confidence threshold) should receive less emphasis based upon the size of the segment.  So, if you ignore that (or just look at the most common ancestry prediction), the results for the V3 and V5 chips are consistent with each other (and other companies) with the broad conclusion that I am of mostly European ancestry.

On the flip side, I should also have some Spanish ancestry, which I don't see with the 90% confidence threshold.  However, I can see that ancestry with 50% confidence on chromosome 3 - in fact, that segment is estimated to be larger (2.1% versus 1.3%) in a later ancestry estimate.  So, unless that ancestry is being represented in another way (defined less precisely), this could be an example of a false negative with the higher confidence threshold.


Free Alternate Ancestry Prediction Options


  • I describe these in more detail on the 1000 Genomes re-analysis page for my 23andMe data (on GitHub).  However, I provide the general links here:
  • Again, it might be possible to have a false positive from multiple programs.  However, I think it is an overall good thing that you have these free options for re-analysis available.


To be clear, I am defining a difference between ancestry and relatedness.  In 23andMe, these are even in different sections ("Ancestry" versus "Family & Friends").  As mentioned in another blog post (please scroll towards the bottom), I believe the close family predictions should be accurate (even though I got a weird result when I uploaded my 23andMe data to FamilyTreeDNA).

However, to be clear, I think "specific" closely related individual predictions should be accurate (and I could in fact verify predicted relatives up to the range of second cousin on 23andMe and AncestryDNA), and this is the different than the more distant "specific" country assignments.  This matches 23andMe's definition of a "close relative."  However, it is hard for me to assess the accuracy of the confidence estimates for increasingly distant "DNA relative" predictions.

Update Log:

8/4/2019 - public post date
8/6/2019 - minor changes
8/14/2019 - minor changes
8/15/2019 - mention issue of RFMix phasing for African ancestry
8/16/2019 - minor changes
9/15/2019 - change title to just refer to myself
9/16/2019 - add link about DNA.land
10/18/2019 - mention aunt with Turner Syndrome (later removed, along with entire section)
10/22/2019 - minor change
12/2/2019 - add links to inpute.me and MySeq
1/27/2020 - add note about Great-Great-Grandfather (later removed)
1/29/2020 - modify notes (based upon what I could verify, even though I will probably have more revisions)
2/1/2020 - further modify notes
2/2/2020 - further modify notes
2/4/2020 - modify content throughout post (including changing the name of the section related to changing the 23andMe confidence thresholds, as well as removing some other details and the section about my mom's chromosome X)
2/5/2020 - additional changes in wording
2/6/2020 - minor changes
3/10/2020 - minor change

Please Take Time to Critically Assess Anxiety-Inducing Results

I am reproducing part of the content from the FamilyTreeDNA GitHub section here:

I received a result that caused me some anxiety for a couple hours (even though I realized it rationally couldn't be true).

Namely, you can upload your 23andMe data to search the database of FamilyTreeDNA members (or other people who have uploaded data).  I was told that there was someone within the range of "Father/Son", who was also an X-chromosome match (and "X-match").  This is not possible: I am a male, so a father or son would have to have a Y-chromosome match (and not an X-chromosome match).

I e-mailed the contact (you can see the e-mail address for your predicted relatives), but I never heard back.  One possibility is that someone could have created a false account that was based upon my public genome data, but I don't know that for certain.  For example, there are a lot of people listed within the range of "2nd Cousin - 4th Cousin," and I don't recognize any of them.  I also don't have access to the raw data for this individual.  In other words, all I know is that this result can't be precise.

For example, as of 10/3/2019, it looks like other people have encountered a similar result with a self-search (so, it may be the "Father/Son" part is not precise, and instead should have said "Self/Twin").  If that is the case, you can see that explanation on Twitter here.  FamilyTreeDNA also confirmed that kits from the same individual (or monozygotic twins) will also appear as "Parent/Child" with 50% similarity, as described in this table.

More importantly, as a general rule, if you encounter a surprising result, I would like to encourage people to first pause and then try to calm down and critically assess the results.  This can go both ways - for example, I would also recommend waiting at least one day before posting anything negative (as probably would have been wise for a Food Sensitivity test, although I have posted an apology in that section).

To be clear, I would usually expect an IBD calculation for the same individual or parent-child relationship to be reliable.  For example, you can see a clear difference when comparing my own samples versus 1000 Genomes samples and most parent-to-child relationships on this blog post (please scroll towards the bottom of the page).  I have also found known and validated novel relationships on 23andMe and AncestryDNA.

Unfortunately, unexpected family relationships can sometimes be true.  However, there can also be limits to the precision of genomics methods and possibly even some allowance for human error (such as sample mix-ups).  So, please take some time to think about making decisions that could affect the rest of your life and may permanently affect your relationships.  For example, to troubleshoot a possible sample swap, do all people involved have predicted relationships with other people fitting the alternative model?  If one person has expected relatives and the other person doesn't have any matches that can be explained, perhaps that indicates the sample that should be re-processed (either with the same company, and/or a different company).

In other words, if you encounter a result that causes you anxiety, please first try to calm down.  Then, please take some time to evaluate the situation: the result could be real, but please also ask questions (from independent resources) about whether there could be misunderstanding and/or inaccurate information that has caused you concern.  For the potential misunderstanding part, perhaps a good first step would be to contact technical support and/or a genetic counselor.


Update Log:

8/4/2019 - public post date
8/6/2019 - minor changes
8/15/2019 - minor changes
10/3/2019 - add solution suggested from Twitter
10/7/2019 - add link from FamilyTreeDNA
7/22/2020 - add link to discussion about uploaded data
6/21/2024 - fix minor typos

Predicting HLA Types for Array and High-Throughput Sequencing Data

My previous link to my HLA-assignments with varying technologies has the most important table in the middle of the page.  So, I am mostly reproducing that here to make the information easier to view.


SNP2HLA HIBAG bwakit HLAminer
HLA-A A*01, A*02
(23andMe)

A*01, A*02
(Genes for Good)

A*01, A*02
(AncestryDNA)
A*01, A*02
(23andMe)

A*01, A*02
(AncestryDNA)
A*01, A*02
(Genos Exome BWA-MEM)
A*01, A*02
(Genos Exome BWA-MEM)

A*01, A*68
(Genos Exome BWA)
HLA-B B*08, B*40
(23andMe)

B*08, B*40
(Genes for Good)

B*08, B*40
(AncestryDNA)
B*08, B*40
(23andMe)

B*08, B*40
(AncestryDNA)
B*08, B*40
(Genos Exome BWA-MEM)
B*08, B*40
(Genos Exome BWA-MEM)

B*08, B*41
(Genos Exome BWA)
HLA-C C*03, C*07
(23andMe)

C*03, C*07
(Genes for Good)

C*03, C*07
(AncestryDNA)
C*03, C*07
(23andMe)

C*03, C*07
(AncestryDNA)
C*03, C*07
(Genos Exome BWA-MEM)
C*03, C*07
(Genos Exome BWA-MEM)

C*03, C*07
(Genos Exome BWA)
HLA-DRB1 DRB1*01, DRB1*03
(23andMe)

DRB1*01, DRB1*03
(Genes for Good)

DRB1*01, DRB1*03
(AncestryDNA)
DRB1*03, DRB1*11
(23andMe)

DRB1*03, DRB1*15
(AncestryDNA)
DRB1*04, DRB1*04
(Genos Exome BWA-MEM)
DRB1*01, DRB1*15
(Genos Exome BWA-MEM)

DRB1*01, DRB1*15
(Genos Exome BWA)
HLA-DQA1 DQA1*05, DQA1*05
(23andMe)

DQA1*01, DQA1*05
(Genes for Good)

DQA1*01, DQA1*05
(AncestryDNA)
DQA1*05, DQA1*05
(23andMe)

DQA1*01, DQA1*05
(AncestryDNA)
DQA1*03, DQA1*03
(Genos Exome BWA-MEM)
DQA1*02, DQA1*03
(Genos Exome BWA-MEM)

DQA1*02, DQA1*03
(Genos Exome BWA)
HLA-DQB1 DQB1*02, DQB1*05
(23andMe)

DQB1*02, DQB1*02
(Genes for Good)

DQB1*02, DQB1*05
(AncestryDNA)
DQB1*02, DQB1*03
(23andMe)

DQB1*03, DQB1*06
(AncestryDNA)
DQB1*03, DQB1*03
(Genos Exome BWA-MEM)
DQB1*02, DQB1*03
(Genos Exome BWA-MEM)

DQB1*02, DQB1*03
(Genos Exome BWA)

In other words, my HLA-A / HLA-B / HLA-C types could be identified more robustly than the HLA-D genotypes (which I don't know, since I haven't gotten a regular blood test).  However, my understanding is that those types have a greater priority in defining organ transplant matches (although I'm currently encountering some difficulty finding the reference for that).

The GitHub link also goes a little deeper into how 23andMe is using 2 SNPs to represent 2 haplotypes (across genes) for celiac disease (which I found surprising, but that is done for other diagnostics as well).  I am mostly leaving that out of this section, but I did think it was interesting that HLA was used in 23andMe's "Meet Your Genes" when the SNPs are actually intronic / intergenic (with respect to the RefSeq annotations).

My 23andMe report indicated that I was DQ8-positive but DQ2-negative for my celiac disease risk.  In terms of defining the 2 genes used to define my DQ8-positive status I coloring matching assignments above in magenta (HLA-DQA1*03 and HLA-DQB1*0302).

Here is a screenshot for the variants tested by 23andMe (where I have the "C" variant for rs7454108, for the marker described as "HLA-DQ8"):


Again, as described here, a positive HLA-DQ8 status is defined by having HLA-DQA1*03 and HLA-DQB1*0302.

More recently, I collected Illumina Whole Genome Sequencing data where unaligned reads were provided (from Sequencing.com), along with some amount of PacBio HiFi data from Dante Labs.  There are some parts of the results that are not especially clear to me and I am interested to learn about additional options for analysis.  However, I believe those results are consistent with me having at least one DQB1*03 allele.

In terms of what appears to be consistent between the PacBio data and Illumina Whole Genome Sequencing data, the T1K results from the Sequencing.com Illumina reads indicates that the related HLA-DQB1 allele should be HLA-DQB1*03:02:01.

I ordered additional GlutenID testing from Targeted Genomics, with an uploaded subfolder on GitHub.  However, I believe the potential problem with using this for validation is that the DQ8-DQ8 result is based upon the same 1 SNP as my 23andMe result (rs7454108).  So, I will continue to look into additional validation options.

I am interested to learn more about the broader trends if certain HLA types are harder to assign and/or impute than other HLA types.  I have some notes mentioned in this Disqus comment.  Comments containing relevant feedback is also welcome on this blog post.

Update Log:

8/4/2019 - public post date
8/6/2019 - minor changes
8/15/2019 - add coloring for HLA-DQ8
2/11/2024 - add information / links to Whole Genome Sequencing data (Illumina from Sequencing.com and PacBio HiFi from Dante Labs)
2/18/2024 - add screenshot from 23andMe + dbSNP link; add additional HLA-DQ8 sentence; add small paragraph for Illumina WGS T1K result; add link to Disqus comment; fix minor typos + add tags
2/27/2024 - minor change in column header
3/19/2024 - minor change in column header; add link to GlutenID results
 
Creative Commons License
Charles Warden's Science Blog by Charles Warden is licensed under a Creative Commons Attribution-NonCommercial-NoDerivs 3.0 United States License.