NOTE: Getting Advice About Genetic Testing
Since my previous post comparing my 23andMe health report to Promethease was so popular, I thought it would be worthwhile to share what I have found from digging a little deeper into my raw 23andMe data.
This analysis required some coding on my part, but I've provided links to see a detailed description of my analysis and how to reproduce this analysis. If you don't want to try and run my scripts on your own data, you can just take a look at the high-level discussion that I have provided below.
Step #1: Annotate SNPs using SeattleSNP
Step #2: Match SNPs in GWAS Catalog
Step #3: Combine SeattleSNP and GWAS Catalog annotations. Add PAM score.
Step #4: Filter combined dataset
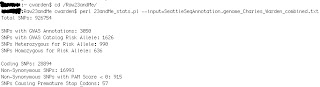
Step #5: Summarize features in combined dataset
Description of my 23andMe SNPs
Number of 23andMe SNPs: 950,566 (v3 array)
Unique SNPs in Combined File (SeattleSNP + GWAS Catalog): 926,754 (97.5%)
Number of SNPs with GWAS Catalog Annotations: 3,050
Number of SNPs with Disease-Associated Alleles: 1,626
-Heterozygous Risk Allele: 990
-Homozygous Risk Allele: 636
Number of Coding SNPs: 288,894
Number of Non-synonymous SNPs: 16,993
Number of Non-synonymous SNPS with PAM Score < 0: 915
Number of SNPs Causing Premature Stop Codons: 57
Integration of SeattleSNP and GWAS Catalog Annotations
If I filter my non-synonymous SNPs for those with odds ratios greater than 2 and a PAM score less than 0, then I can idenify a single SNP (rs1260326) with 3 entries in the GWAS catalog for associations with triglycerides (OR = 8.8, Teslovich et al. 2010), liver enzyme levels for gamma-glutamyl transferase (OR=3.2, Chambers et al. 2011), and platelet counts (OR = 2.3, Gieger et al. 2011). This allele is present in approximately 40% of the population, and it changes the coding sequence of glucokinase (hexokinase 4) regulator (GCKR). Reviewing Chambers et al. 2011 was especially interesting because GCKR was selected as one of the five genetic loci to also be tested for correlations with metabolomic data (figure 3 of that publication). In fact, GCKR seems to show the strongest correlation with increased LDL and VLDL in that figure.
NCBI Gene also indicates that GCKR is associated with diabetes, which is also described in the text for Chambers et al. 2011. Chambers et al. 2011 classify GCKR as a gene associated with inflammation, as measured by concentrations of C-reactive protien (CRP) in Elliott et al. 2009. As a general note, all of these publications require a subscription, but NCBI Gene is a good free source of information about gene functions.
The nice thing about these associations is that many of them are measured with routine blood tests. Although I have always received normal blood test results, I can easily keep an eye out for changes in the future. More specifically, Chambers et al. 2011 show an association between my GCKR SNP and gamma-glutamyl transferase levels (GGT), which is "sensitive to most kinds of liver insult, particularily alcohol" (citing Pratt et al. 2000). So, perhaps this can encourage me to continue to drink only in moderation.
Comparison with Previous Analysis
In my previous blog post, I highlighted 3 disease associations: venous thromboembolism, rheumatoid arthritis, and type I diabetes. Of course, none of these associations are identifed if I filter both by GWAS Catalog odds ratios and PAM scores, but I do find 3 SNPs associated with rheumatoid arthritis if I only filter for GWAS Catalog associations with an odds-ratio greater than 2.
The reason I didn't originally see these SNPs in my first filter is that none of them cause non-synoymous mutations. Like most of the SNPs, they were not located in coding regions. Unfortuantely, it is harder to characterize the likely function of these types of mutations, but this is certainly an exciting area of on-going research.
If I look at the GWAS catalog annotations for my SNPs, I can confirm that the GWAS catalog does contain SNPs associated with venous thromboembolism and type I diabetes (in fact, there are a lot of SNPs associated with type I diabetes), and I can confirm that I am a carrier for some of these risk alleles. However, none of these SNPs showed associations with odds ratios greater than 2.
Although I am emphasizing the overlap between different methods of analyzing my 23andMe data, I think it would be too conservative to say that only candidates that are independently identified are worth examining. For example, it is very hard to determine the best way to predict the interaction of different variants. In fact, I found it especially exciting to read about the GCKR SNP that didn't jump out at me from any of the other analysis, and I think gaining exposure to genomics research is very important benefit of having direct-to-consumer genetic testing.
Showing posts with label GWAS catalog. Show all posts
Showing posts with label GWAS catalog. Show all posts
Thursday, June 14, 2012


Summarize 23andMe SNP Categories
The primary goal of this script is to provide statistics about your 23andMe SNPs (number of annotated SNPs, number of homozygous / heterozygous disease assocations, number of coding SNPs, etc.)
Step #1:Create a

I have tested my perl scripts on a PC and Mac, but I cannot guarentee that they will work on every possible platform. Also, these scripts may need modifications as file formats change, but I have currently confirmed that my scripts work with v2 and v3 arrays using genomes from Genomes Unzipped. If you have any questions or comments, please post them below and I will do my best to help troubleshoot.
Step #1:Create a
- Prepare combined SNP file (click here for details)
- This will also work for filtered files (check here for details)
- Download the perl script 23andMe_stats.pl
- There is one parameter that you need to enter:
- inputfile = file containing 23andMe SNPs with both SeattleSNP and GWAS Catalog annotations (click here for details)
- PC Users
- Open a terminal window (type "cmd" in Run, for example)
- Move to the folder where your 23andMe data is saved.
- Basic commands:
- cd = change folder
- If the data is not in your C:\ drive, you can type "cd \d D:"
- .. = move up one folder
- Type in "perl 23andMe_GWAS_stats.pl" and enter the required genome parameter. See example below (click to enlarge) .

- Mac Users
- Open Terminal (in Applications/Utilities, for example)
- Basic commands:
- cd = change folder
- .. = move up one folder
- Type in "perl 23andMe_GWAS_ stats .pl" and enter the required genome parameter. See example below (click to enlarge) .
I have tested my perl scripts on a PC and Mac, but I cannot guarentee that they will work on every possible platform. Also, these scripts may need modifications as file formats change, but I have currently confirmed that my scripts work with v2 and v3 arrays using genomes from Genomes Unzipped. If you have any questions or comments, please post them below and I will do my best to help troubleshoot.
Filter Combined Annotations for 23andMe SNPs
Step #1: Prepare Inputfile


- List of 23andMe SNPs with both SeattleSNP and GWAS Catalog annotations (click here for details)
- Download the perl script 23andMe_filter.pl
- There is one parameter that you need to enter:
- input = file containing 23andMe SNP file with SeattleSNP and GWAS Catalog SNPs (see here for more details)
- There is 5 optional parameters that you can enter:
- output = output file containing filtered SNP lists. By default, _filter.txt is appended to the end of the input file
- OR = odds ratio cutoff (filter for scores greater than cutoff) [default = 2]
- PAM = PAM score cutoff (filter for scores less than cutoff) [default = 0]
- risk_status = status for GWAS Catalog risk allele, Either "Homozygous", "Heterozygous" (which actually filters for both homozygous and heterozygous risk alleles), or "none" [default = "Heterozygous]
- allele_freq = set of parameters to describe allele frequency cutoff. If provided, parameter must be the following format [genetic background]_[comparison type]_[threshold] For example, European_gt_0.25. [default = "none?]
- Genetic background can be "European", "African", and "Asian"
- Comparison type can be "gt" for greater than or "lt" for less than
- Threshold corresponds to the population frequency. Must be between 0 and 1.
- PC Users
- Open a terminal window (type "cmd" in Run, for example)
- Move to the folder where your 23andMe data is saved.
- Basic commands:
- cd = change folder
- If the data is not in your C:\ drive, you can type "cd \d D:"
- .. = move up one folder
- Type in "perl 23andMe_filter.pl" and enter the required input parameter. See example below (click to enlarge) .

- You can also enter in optional parameters (OR, PAM, risk_status , and/or allele_freq ). See example below (click to enlarge) .

- Mac Users
- Open Terminal (in Applications/Utilities, for example)
- Basic commands:
- cd = change folder
- .. = move up one folder
- Type in "perl 23andMe_ filter.pl" and enter the required input parameter. See example below (click to enlarge).
- You can also enter in optional parameters (OR, PAM, risk_status , and/or allele_freq ). See example below (click to enlarge) .
I have tested my perl scripts on a PC and Mac, but I cannot guarentee that they will work on every possible platform. Also, these scripts may need modifications as file formats change, but I have currently confirmed that my scripts work with v2 and v3 arrays using genomes from Genomes Unzipped. If you have any questions or comments, please post them below and I will do my best to help troubleshoot.
Find 23andMe SNPs with GWAS Catalog Annotations
Although there are other tools to help sort through the annotations in the GWAS Catalog, I've found that none of them to completely satsify my needs. More importantly, SeattleSNP clinical associations don't directly provide the name of the disease they are associated with and are not identical to the annotations in the GWAS Catalog. So, this information is meant to complement the report that can be obtained from SeattleSNP.
Step #1: Download GWAS Catalog Data
Step #2: Find Overlapping SNPs

 I have tested my perl scripts on a PC and Mac, but I cannot guarentee that they will work on every possible platform. Also, these scripts may need modifications as file formats change, but I have currently confirmed that my scripts work with v2 and v3 arrays using genomes from Genomes Unzipped. If you have any questions or comments, please post them below and I will do my best to help troubleshoot.
Step #1: Download GWAS Catalog Data
- There should be a link on the main GWAS catalog website to download the full catalog. As of today, you can click this link to view / download the annotations.
- For most internet browsers, you can download the data as a tab-delimited file by right-clicking on the link and then left-clicking "save target as...".
- Please no not copy and paste the table from your browser. This may not preserve the proper formatting
- Please save the GWAS annotations in the same folder as your 23andMe data
- The file is currently saved as gwascatalog.txt. If the name of this file changes in the future, please rename the file gwascatalog.txt
Step #2: Find Overlapping SNPs
- Download the perl script 23andME_GWAS_catalog.pl
- There is one parameter that you need to enter:
- genome = raw data file from 23andMe
- The resulting output file with have _GWAS.txt appended to the name of the genome file
- PC Users
- Open a terminal window (type "cmd" in Run, for example)
- Move to the folder where your 23andMe data is saved.
- Basic commands:
- cd = change folder
- If the data is not in your C:\ drive, you can type "cd \d D:"
- .. = move up one folder
- Type in "perl 23andMe_GWAS_catalog.pl" and enter the required genome parameter. See example below (click to enlarge) .

- Mac Users
- Open Terminal (in Applications/Utilities, for example)
- Basic commands:
- cd = change folder
- .. = move up one folder
- Type in "perl 23andMe_GWAS_catalog.pl" and enter the required genome parameter. See example below (click to enlarge) .
- You can open and manipulate the resulting file in Excel (or OpenOffice Calc)
Sunday, February 27, 2011
My 23andMe Results: Getting a (Free) Second Opinion
NOTE: Getting Advice About Genetic Testing
In order to get an idea about how well the 23andMe risk calculator agrees with other algorithms (when using the same exact same SNP data), I searched for other tools that I could use to analyze my genetic data.
In order to get an idea about how well the 23andMe risk calculator agrees with other algorithms (when using the same exact same SNP data), I searched for other tools that I could use to analyze my genetic data.
For this post, I have compared my risk assessments from 23andMe to those provided by Promethease (which uses the information available in SNPedia). I also played around with the free version of Enlis Genome (Personal Edition), but I found the GUI to be a little buggy and they didn’t automatically prioritize risk assessments (unlike 23andMe and Promethease). So, this post will focus only on comparing my 23andMe assessment with my Promethease assessment.
To be fair, I should point out that I would not necessarily expect 100% concordance between my 23andMe and Promethease results for various reasons. For example, the “magnitude” score from promethease is a subjective measure, and the curation methods are different for these two tools. However, I think such a comparison will still be useful because it will still be encouraging to see any predictions that are shared by both tools, and I think both of these tools provide useful information since there is no “standard” way to combine all possible associated SNPs associated with a particular disease.
I will focus on my increased disease risks, but the same principles could be applied to decreased disease risk, drug response, or any other trait.
All Diseases with Increased Risk
 |
NOTE: Percentages refer to percent of individuals with my genotype that have a particular disease, and the relative risk compared to average percentage is given in parentheses. Percentages are not given for Promethease results because the percentage provided in the summary report refers to the population frequency of the SNP and not the percent of individuals with that SNP that will have a particular disease. Only Promethease results with clearly defined disease names and relative risk values were considered. Promethease cutoff chosen based upon change in color from pink to red in summary report (and also the number of associations listed at this threshold). 23andMe risk assessment was recorded on 2/26/2011. Promethease report was generated on 1/27/2011. Multiple values are provided for Promethease but not 23andMe because promethease provides risk assessments for individual SNPs whereas 23andMe provides a single risk value for each disease.
|
Overall, I thought that there was pretty good agreement between the two methods. This may not be apparent from the table above, but that is because my list of “higher importance” SNPs is considerably smaller but with greater overlap. For example, I would have ideally preferred to look at SNPs with a 1.5x increase in risk and an absolute risk greater than 50%. The absolute cut-off of 50% is because I would prefer to look at SNPs where I am more likely to get the disease than not get the disease. The 1.5x (or 50% increase in risk) is a somewhat arbitrary cutoff that is loosely based upon my microarray data analysis experience. Since no SNPs meet both of these criteria, I chose to look at those with a greater than 1.5x relative risk and greater than 5% absolute risk (which, in my opinion, is still quite low). Now, take a look at my more subjective SNP list.
“Higher Priority” SNPs

Now, 2 out of the 3 SNPs have similar predictions. Although there wasn’t a high magnitude SNP in promethease for venous thromboembolism, this could be because I subjectively considered this disease to be less well known than arthritis or diabetes, so I figured less popular diseases may have lower magnitude scores. For this reason, I decided to look into what SNPs are used by 23andMe and promethease to determine venous thromboembolism risk. I also checked the Genome-Wide Association (GWAS) Catalog to try and get a idea which SNPs are the best established (according to the US National Human Genome Institute).
SNPs Associated with Venous Thromboembolism Risk
23andMe
|
Promethease
|
GWAS Catalog
| |
rs6025
|
Yes
|
Yes
|
No
|
i3002432
|
Yes
|
No
|
No
|
rs505922
|
No
|
Yes
|
Yes
|
NOTE: Promethease lists 19 SNPs associated venous thrombembolism. In order to simplify the table (and avoid listing some potentially inaccurate and/or low-confidence associations), I have only listed SNPs listed by 23andMe or the GWAS Catalog.
Now there is agreement between the 23andMe and Promethease results because both tools indicate that I have a mutation in rs6025, which results in an increased risk of developing venous thromboembolism. However, I think it is worth pointing out that the results are not quite as clean as they could be. For example, this SNP was not listed in the GWAS Catalog, and I couldn’t determine the dbSNP annotation for i3002432 (so it was relatively hard for me to cross-reference this result with other databases).
Another topic that is worth considering is family history. Before I saw my results, there were 3 diseases that I wanted to check due to family history: type I diabetes, type II diabetes, and macular degeneration. Thus, it was interesting to see type I diabetes come up in both reports. Although I doubt that I will get type I diabetes (since the absolute risk is low and this disease usually appears during childhood), this information may still be useful if these mutations have other affects and/or increase the likelihood of children inheriting type I diabetes.
On the other hand, I didn’t see results indicating a increase in risk for type II diabetes and there were some conflicting results about macular degeneration. Of course, family history is not a gold standard, and I may very well never develop type II diabetes or macular degeneration. However, I think it is important to think carefully about ambiguous or uncertain results. For example, this could be done by comparing SNP association to family history as well as considering both genetic and non-genetic risk factors for disease (the later is the topic of my second post).
Tuesday, February 16, 2010
Playing with the GWAS Catalog
When I was looking at an article in PLoS Biology, I noticed that the abstract listed a comprehensive government database for genome-wide association studies (the “GWAS Catalog”). This database provides a lot of interesting information. In order to get a feel for the data in the GWAS Catalog, I looked at the data for four specific diseases (autism, prostate cancer, type I diabetes, and type II diabetes).
[If you are a non-scientist looking at this database, stronger genetic associations (which should more accurately predict genetic predisposition to a disease) should have low p-values and should be reproducible between different studies.]
1) Autism - There were 3 studies included in the GWAS Catalog. The first two studies identified the same exact region (but with slightly different variants), and the third study identified a different but nearby region. Although I think that there is probably something interesting going on in this region of chromosome 5, I don’t think it is worth getting very excited about the specific variants identified in these studies. For example, the p-values for the autism studies are the lowest out of the four diseases that I analyzed (meaning autism has the weakest genetic component and/or the genetic component of autism is the most complex to model). Furthermore, the most recent study showed that the expression levels of SEMA5A (one of the genes listed in the GWAS Catalog for autism) are very similar for autistic and normal people (see Fig 2. if you have access to this article). The authors of this study claim that gene expression in autistic patients is significantly lower than in normal patients, but I think the statistical significance may be due to an over-fitting problem because they only look at 20 autism patients and 10 control patients (and I have a hard time believing this was enough data to adjust for “age at brain acquisition, post-mortem interval and sex”). The genes with the strongest genetic association in the first study (CDH10 and CDH9) also have similar expression patterns in both autistic and control patents, and the authors of this first study report that this difference is not statistically significant. Of course, the autism variants may be non-functional yet retain similar gene expression levels, but I would still seriously question the strength of any of the specific variants listed in these studies.
2) Prostate Cancer – I looked at the data for prostate cancer, type I diabetes, and type II diabetes because variants for these three diseases are included in at least two of the three major genomic tests listed in “The Language of Life.” More specifically, the three major genomic testing companies gave completely different predictions regarding Dr. Collins’ risk of getting prostate cancer. The GWAS Catalog lists 11 studies (10 of which have significant associations), and the genetic associations for prostate cancer were much stronger than for autism (p-values equal 3 x 10-33 vs. 2 x 10⁻¹⁰, respectively). Highly significant genetic associations were found within the 8q24.21 and 17q12 regions in several independent studies, but many associations are only found in individual studies. According to “The Language of Life”, deCODE has 13 variants for prostate cancer, Navigenics has 9 variants, and 23andMe has 5 variants. Based upon what I’ve seen in the GWAS Catalog, I think that there probably are at least 5 strong, reproducible variants that could be used to calculate genetic predisposition to prostate cancer, but I am not certain if there 13 variants with well-established genetic associations. However, calculating genetic association for several variants at the same time can be tricky, and the difference in test results may be a problem with the underlying models for calculating genetic association more so than the individual variants considered for the analysis.
3) Type I Diabetes – Type I diabetes has a very strong genetic component, and the molecular basis for this disease is well understood. In these respects, the data in the GWAS Catalog are a good reflection of what is known about this disease. The strongest associations had the lowest p-value out of all the diseases considered (5 x 10-134 for a variant within the Major Histocompatibility Complex, or MHC), and either MHC or HLA (which is part of the MHC) had the strongest genetic association for 4 out of the 8 studies in the GWAS Catalog. This makes a lot of sense because the MHC displays antigens to immune system (thereby telling the body which cells to attack) and type I diabetes is due to due to an autoimmune response where the immune system attacks and destroys the insulin-producing beta cells in the pancreas. It bothered me that some studies reported pretty different results, but that is why I think that it is necessary to only use reproducible associations for genetic testing.
4) Type II Diabetes – The GWAS Catalog contained 15 studies on type II diabetes (12 of which had significant results), which is the highest number of studies listed for the four diseases that I looked at. The strongest associations for type II diabetes had p-values similar to prostate cancer, but higher than type I diabetes. This makes sense because type I diabetes has a stronger genetic component than type II diabetes, so type II diabetes should have weaker associations than type I diabetes. The 8 genes listed as predictors of type II diabetes in “The Language of Life” (TCF7L2, IGF2BP2, CDKN2A, CDKAL1, KCNJ11, HHEX, SLC20A8, and PPARG) were pretty well represented among the different studies listed in the GWAS Catalog, so I bet the predictors of genetic predisposition to type II diabetes are pretty good.
Subscribe to:
Posts (Atom)


 Posts
Posts


