Showing posts with label imputation. Show all posts

Saturday, February 27, 2021

Why I think the basepaws "Breed Group" should be called an "Ancestry Cluster" (with abstract cluster names)

Part #1: Short Summary:

In the basepaws Facebook group, there are some noticeable issues with results for purebred cats that are not already part of the reference set (as I understand it).  To be fair, I have seen at least one report that was a good result (matching the known breed in a new test cat), but I think independent test datasets tend to be discordant with known purebred cats more often than they are concordant with new purebred cats (in the small fraction of customers where that can be tested).  Also, the majority of cats are mixed breed "Polycats" where there probably shouldn't be any close purebred relatives, and I think the results more-or-less match that expectation (if interpreted correctly, and I have found explaining precisely what I think is "correct" interpretation to be bit of a challenge).

Again, to be fair, basepaws does say "Disclaimer: The Basepaws Breed Index is not a breed test".  However, I think there is still some noticeable confusion.  So, regardless of whether my suggestion is helpful, I think it is safe to say you should not be using basepaws to confirm your cat's breed or disprove your cat's breed, and you may not have closely related cats for the "breed" with the highest estimated breed fraction in chromosome painting (which, in the wording of the current reports, may be "Breed Group" instead of "Breed Index" - either way, this is what you receive when you order the Breed + Health DNA Test, and you can see some type of chromosome painting in the various reports for Bastu).

After having several very helpful discussions, I thought of a possible suggestion that I thought might help: perhaps use a more abstract name for an ancestry group / cluster to make clear that you shouldn't use what is being provided to define breeds.

I think the best example may be the broad "Eastern" ancestry group, which is already in the reports (as a broader category) as well in previous literature on cat genomics.

If calculated accurately, I would expect Siamese cats will tend to have a higher estimate of Eastern contribution (at least for the "Traditional" Siamese cats, as I understand it).  However, I think the Colorpoint Restriction mutation might be what owners might want to check for cats with the characteristic hair color pattern.  For example, you might have to dig around a bit in the comments for this video but I believe "Lynx Point" cats can be defined from 2 markers (the Colorpoint Restriction variants, and Agouti variants for the tabby pattern).

Nevertheless, my point is that I believe giving the ancestry group the "Eastern" name adds a layer of conceptually separation than the "Siamese" (or related) breeds.

So, if technical problems are minimal, then I think this might reduce confusion for purebred cat owners (as well as minimize miscommunication from misunderstanding).  It might also reduce interest, but I would rather plan to have fewer customers than have more customers whose satisfaction might decrease over time.

It might also be worth noting that I believe most imputed genotypes are phenotypically neutral, meaning that they do not cause the traits that are used to define the breeds (although relatedness does define the breed, once it becomes established).

There are some additional details that I will discuss below, but I hope this can help for discussions (instead of me posting several comments, which may or may not be appreciated by all basepaws customers).  I also have a "Change Log" since I hope that I can update this based upon feedback, in order to try and be able to explain my point as precisely as possible.

Part #2: Intermediate-Level Details:

I have a separate blog post describing results (from multiple organizations / companies) for my cat Bastu.

However, I will copy / repeat some points below.  Some hopefully complement the main point for the "Short Summary," but some of these are separate points.

First, I think seeing 3 technical replicates for my 1 cat may be helpful in giving a sense of confidence in the results:

"Confident" Threshold


"Possible" Threshold


All 3 reports above were re-processed at the same time (for an update), but they were sequenced in different batches.

If you look at the broad ancestry groups, then there is some noticeable consistency with the technical replicates.  A mostly "Western" contribution for Bastu also makes sense, and that is also consistent with the her Ancestry Test from UC-Davis.

Please also note that the 1st 2 samples (left and middle) are low coverage Whole Genome Sequencing (lcWGS) and the report on the right is "regular" coverage sequencing (~15x).

For example, initiatively, I would not expect Bastu to be related to any Exotic breeds.  So, in addition to the general issue that accurately genotyped variation can exist before breed creation and confound the results, you can see the "Exotic" contributions go away in the higher/regular coverage sequencing data.

The main reason that I purchased the "Whole Genome Sequencing" kit was that I would get access to the raw data.  Since the price is different now, I will include the analysis part of this file below (without the header listing the original price):

Again, noticed the relatively higher Western contribution is also consistent with my re-analysis.
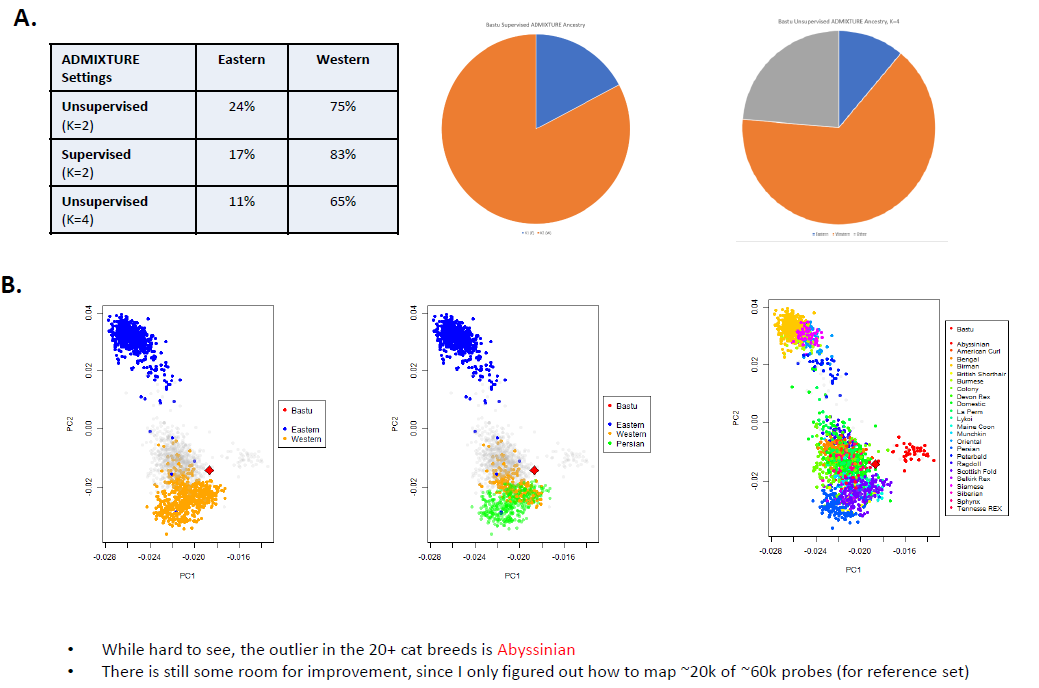


While I want to make clear that the PCA plots (the dots in the bottom part of the image, which I tried to describe as part "B") come from a relatively limited number of SNPs (from public cat SNP chips).  So, I don't know what the spread looks like if you could look like if you could see the individual points in the basepaws data, but I think plotting a centroid may not be the best way to represent the data (if that is what was done here).

There has also been at least 1 sample mix-up (for a different customer).  However, basepaws offered a free re-test which showed much better results.  So, that can happen, but I am guessing that is rare (and the more common issue is what I am describing in this blog post).  For example, when you look at my 2 lcWGS replicates (equivalent to a paid re-test), one is not really better than the other.  There is just a certain about of noise and limits to the methods (at least currently).

Part #3: Advanced Details:

With my ~15x cat genome data (along with my human data), I tested running imputation of down-sampled reads, which you can see here.  I am also plotting that below:
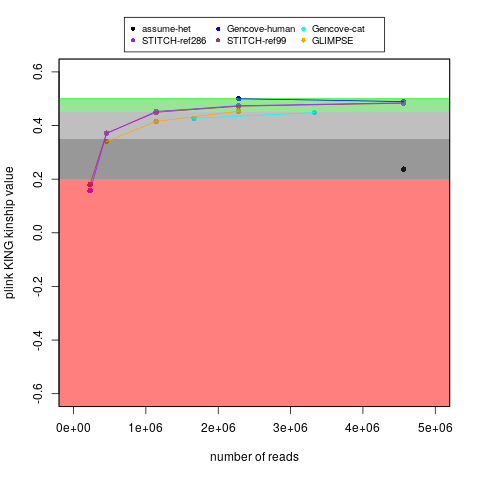


For reference, I don't have the raw lcWGS FASTQ data, but earlier versions of reports said that technical replicate #1 had 3,488,515 fragments and technical replicate #2 had 2,712,098 fragments.  For comparison, my regular coverage WGS sample had 166,490,724 paired-end reads (I think comparable to the "fragments" in those reports).

Because of the fragments smaller than the read length, my "regular" coverage WGS was closer to 15x than 20x.  I also don't know how many fragments are for lcWGS versus Amplicon-Seq in the "Breed + Health" results.  Nevertheless, I think the lcWGS "fragments" in those earlier reports roughly match an expectation of being 0.1x to 0.5x.

My main goal in the above plot was to test self identification.  With the same number of reads, the Gencove cat imputation worked a little worse for my cat's sample than my human sample (for either Gencove or open-source options for humans), but I don't think that is surprising because I think the human variation is better understood.  Nevertheless, if you follow the Gencove-cat trajectory, then I think there might be some benefits to having ~2x the fragment count (even though I would probably still not consider that to be equivalent to genotypes without imputation).  That said, to be fair, I don't know if some things (like broad ancestry groups) might be detectable with less precision than being able to self identify your own (cat's) sample.  Also, if a relative finder function is added, then Bastu's 2 lcWGS technical replicates can act as a positive control (to gauge how important this measure really was).

Likewise, I believe there is at least the Martin et al. 2021 paper emphasizing a noticeable advantage to using 4-6x WGS (over 0.5x WGS).  For example, there is a noticeable difference for the 0.5x results in Figure 4A (and as well as Table S4 and Table S5).  That is for certain populations, but it seems like that may match what I am seeing as well?

Perhaps most importantly, to give some more examples of selected problems on the human side, you can also see issues with the human lcWGS imputation here at the level of individual genotypes, which I think may be why Nebula now only provides regular/high coverage sequencing for customers.

basepaws uses Amplicon-Seq (not the lcWGS) for the health markers, so I believe those should be thought of as independent results (and the technical replicate discordance is not necessarily predictive of the concordance for the health markers).

My understanding is that basepaws is planning on adding Amplicon-Seq for trait markers in the future.  I think this will be added to the existing report for the "regular" coverage sequencing data.  However, customers will need to keep in mind this can't (or at least shouldn't) be added from the lcWGS.  My understanding is that the additional cost to add those extra Amplicon-Seq markers to previous reports will be minimal, but I think that is worth making clear new libraries need to be prepared to return those results.

It might not be the most important point, but I wanted to acknowledge that I believe what basepaws is doing with the chromosome painting is better than produced got for Bastu's sample with RFMix (which you can see here, for example, if you scroll towards the middle of the post).  However, I thought that was sufficiently far from being a reasonable result that I did not include that in my mini-report of re-analysis that I showed above.  I am also expressing similar concerns for the technical replicates above.

So, in the immediate future, I am not sure if doing something like the ADMIXTURE analysis used for the table and pie charts might help with giving robust results for those broad ancestry groups (which I think should also work with closely related cats, if you used something like plink kinship).  If there were any issued with defining relatedness with the chromosome painting results, then I think that that should be OK with enough reads for 1 genome-wide estimate (and I would rather have a close cat relative finder than a breed index/group that might cause confusion and may not be great at identifying breeds in new test samples, like what I have seen in the Facebook discussion group).  However, either way, that is the explanation for what I presented in my "mini-report" from re-analysis of raw "regular" coverage sequencing data.

Part #4: Acknowledgements:

I can't thank the other basepaws customers enough for their discussions, which have helped me sort through my thoughts.  I also hope that can continue in the future!

The basepaws staff has also provided responses to all of my e-mails.  For example, I think that is how I know the Breed Index/Group (which shouldn't be used to categorize purebred cats) comes from lcWGS and the health markers come from Amplicon-Seq (also verified here).  So, thank you for your helpful feedback, as well as encouraging a community were such discussion can take place!

P.S. I have some on-going notes about known traits (not currently in the basepaws report), but I would be happy to hear more.  This includes things like long hair.

In general, I tend to provide things like links to informational details from the UC-Davis VGL, but I am encouraging you to us the links on the informational page to purchase those separate tests.  For example, I purchased the UC-Davis "Cat Ancestry" panel that includes some trait markers as well the Optimal Selection panel (also mentioned in the earlier blog post).

If you are a breeder, I think part of the goal of Optimal Selection is to identify mating pairs with the maximal possible diversity within the breed.

Maybe it is otherwise a little off-topic, but I mention this because I think people purchasing the Breed + Health kit might in fact be interested in understanding some of the traits that they see in thier cat.

P.P.S. If a relative finder was added and both parents were in the basepaws database, then that would in fact be relevant for confirming that a cat is purebred (as long as there were no methodological issues, or especially low read coverage).  However, that is not currently offered from basepaws, so that is why I am saying that the current breed measures cannot be used to determine your cat's breed (as also said in the disclaimer from basepaws).

Change Log:

2/27/2021 - public post

2/28/2021 - minor changes (including switching wording from "Breed Index" to "Breed Group")

3/6/2021 - add notes for some other common questions and caveats + minor change

3/15/2021 - add lcWGS fragment counts (and linked image)

3/26/2021 - add note to make clear that all 3 reports were re-processed at the same time + add link to Martin et al. 2021 lcWGS paper

3/28/2021 - add extra details / minor re-organization; correct misunderstanding of table

4/18/2021 - add sentence about basepaws sample mix-up

11/21/2021 - add note about 2 markers defining "Lynx Point".

Sunday, August 4, 2019

Concerns About Using Low-Coverage Sequencing for Trait or Health Results

This is a subset of my notes from my Nebula lcWGS sequencing on GitHub:

NOTE (2/24/2020): Nebula is currently offering 30x sequencing.  So, my concerns about the low coverage Whole Genome Sequencing (lcWGS) at ~0.5x are probably less relevant for that particular company.  However, if you get lcWGS from another company, then this information is probably relevant.

Concerns about Specific Variants

While I very much support providing FASTQ, BAM and VCF data, one of my concerns about the Nebula results was the use of low-coverage sequencing.

So, one of the first things that I did was visualize the alignments for some of my more confidently understood variants from previous data (using IGV).

For the two alignments below, the Genos Exome is the top alignment, the Nebula low-coverage alignment is in the middle, and the Veritas Whole Genome Sequencing (WGS, regular-coverage) is at the bottom.

My cystic fibrosis variant (rs121908769):


My APOE Alzhiemer's risk variant (rs429358, Nebula alignment in middle, variant is red-blue bar in the right-most exon):


For APOE, I zoomed out from the screenshot so that you could get a better perspective of the error rate per-read at other positions around the gene.

You could see my cystic fibrosis variant in the 1 read covered at that position, but you can't see any reads with the APOE variant.  My concern about the use of low-coverage sequencing is due to imputation (at least for traits).  Even though this APOE variant is somewhat common (I believe ~15% of the population), the imputation failed to identify me as having that variant.  You see that from the .vcf files

My APOE Alzhiemer's risk variant:

19      45411941        rs429358        T       C       .       PASS    .       GT:RC:AC:GP:DS  0/0:0:0:0.923102,0.0768962,1.71523e-06:0.0768996

As described in the gVCF header:

GT = Genotype
RC = Count of Reads with Ref Allele
AC = Count of reads with Alt Allele
GP = Genotype Probability: Pr(0/0), Pr(1/0), Pr(1/1)
DS = Estimated Alternate Allele Dosage

The "0/0" (for genotype/GT in the last column) means that low-coverage imputation couldn't detect my APOE variant.  In other words, I believe Nebula incorrectly estimates my genotype to be 0/0 with a probability of 92.3%, and the probably for the true genotype was 7.7%.  I also see a blog post mentioning that these probabilities are provided to users through the web-interface, although I am having difficulty in finding them without the gVCF (and you won't see them in the PDFs that I have uploaded in this section).

Update (8/5): Nebula support got in touch with me and explained that the blog post is in reference to Nebula Research Library (rather than the "Your Traits" section).  I canceled my subscription, I am still able to confirm that I see this under the "Library" section (rather than "Traits," "Ancestry," or "Microbiome").

Likewise, there was no delTT variant in the VCF, so my cystic fibrosis carrier status would also be a false negative (if that was used in the report), even though you could actually see that deletion in the 1 read aligned at that position (because 1 read wasn't sufficient to have confidence in that variant).

Overall Variant Concordance

I can also use my VCF_recovery.pl script to compare recovery of my Veritas WGS variants in my Nebula gVCF.

If you compare SNPs, then the accuracy is noticeably lower than GATK (and even lower than DeepVariant):


3,071,596 / 3,419,611 (89.8%) full SNP recovery
3,184,641 / 3,419,611 (93.1%) partial SNP recovery

The indels are harder to compare (becuase of the freebayes indel format).  So, in the interests of fairness, I am omiting them here (as I did for comparing the provided Genos Exome versus Veritas WGS variants).  However, instead of comparing the provided Veritas WGS .vcf file, I can try comparing the BWA-MEM re-aligned GATK Veritas WGS .vcf (which also had higher concordance between my Exome and WGS datasets):


3,133,635 / 3,419,611 (91.6%) full SNP recovery
3,248,277 / 3,419,611 (95.0%) partial SNP recovery
164,140 / 217,959 (75.3%) full insertion recovery
180,736 / 217,959 (82.9%) partial insertion recovery
190,452 / 266,479 (71.5%) full deletion recovery
213,131 / 266,479 (80.0%) partial deletion recovery

The GATK recovery is a little better.  However, it is very important to emphasize that the gVCF variants do not have 99% accuracy (even for average accuracy, or even for SNPs).  I think whatever benchmark was used for that calculation was probably over-fit on some training data.  To be fair, I think the average SNP chip concordance (with higher coverage WGS data) is also lower than some people might expect, but it is definitely higher than this lcWGS data.

You can also show similar results with precisonFDA (using the BWA-MEM realigned GATK gVCF, which we expect to have better concordance than the provided Veritas gVCF).

For example, the overall file shows noticably low recall when comparing the Nebula imputed gVCF versus the Veritas WGS BWA-MEM re-aligned gVCF:


and, to be more fair for the Exome versus WGS comparison in the blog post, the trend is similar within RefSeq CDS regions:


The screenshots are smaller than in the blog post because there was no precision-recall plot for the Imputed Nebula gVCF comparisons.

So, I  disagree with the use of low-coverage sequencing for traits, and I would respectfully consider removing this section (or only made available to those with higher-coverage sequencing).

When I was trying to upload my raw data to my Personal Genome Project page, I noticed that they had an option called "genetic data - Gencove low pass (e.g. Nebula Genomics)".  This makes me think discouraging low-coverage sequencing is something that needs to be done more broadly (at least for health traits).


Concerns abut Nebula Library Results

My concerns for the previous sections are probably solved when using the higher coverage sequencing data.  So, unless you were an earlier customer and had the lower coverage sequencing data, you probably don't have to be extra careful about possibly overestimated accuracy in your genotype imputations.

However, there is one thing that I think could still be a problem for customers with higher coverage sequencing data (if the reports are the same).  The concept is similar to my concern about the basepaws breed index (described in this blog post) and/or other Polygenic Risk Scores that I have collected for myself, but I think I can explain my concern with the top 3 percentile results that I received from Nebula:


As you can see from this link, the percentile above was calculated using 13 SNPs.  Seven of the thirteen SNPs are on chromosome 6, and 5/7 of those variants didn't have alignments against the main reference chrososome (for hg19) in my higher coverage Veritas Whole Genome Sequencing data.  Nebula predicted 3-4 of those 7 chromosome 6 variants to be homozygous variants, but I am not sure if these are correct or not (and the nucleotide for rs3763312 was different from the variants in dbSNP).  There were a pair of variants on chromosome 10 where I was predicted to be heterozgyous at both sites.  For the remaining 6 non-chr6 variants, I had imputed genotypes for 2 heterozygous variants, 2 homozygous non-reference variants, and 2 homozygous reference variants (and they matched my higher coverage WGS data).

I am only 34, but I definitely don't have hair that looks like the Google images for this disease.  So, I don't know the expected age of onset, but I think I might never get this condition (even though Nebula says that I am at the 100th percentile).


As you can see from this link, the percentile above was calculated using 15 SNPs.  12 of those SNPs had at least 1 variant from the reference genome and 11/12 of those variants matched by Vertias WGS variants.  The discordant variant was rs6910071, which was homozygous for the variant allele on the Nebula lcWGS imputed variants.  So, this could have been consistent with 90% overall accuracy, but I didn't have coverage for either dataset at this position (so, this isn't the same as using a gVCF to make a homozygous reference genotype call).

I have osteoarthritis in my lower back, but I don't believe that I (currently) have rheumatoid arthritis.

While I could believe that I am at increased risk, it is important to note that the summary only describes 4% of variance in disease risk.  I think this should be described for all of the reports, to give a sense of the predictive power (along with other statistics).

I also noticed most of the variants were not present in ClinVar (when I was using dbSNP to check the hg19 genome coordinates and reference allele).


As you can see from this link, the percentile above was calculated using 56 SNPs.

I have blood test results uploaded on my PatientsLikeMe profile, and I thought that I had a normal CRP result.  However, it appears that I might not have remembered that correctly, and I might need to wait until my next checkup to see if I can test my CRP level.  However, this is something where I think it would be relatively easy to show if being at the 99% percentile substantially affects your observed CRP levels (or whether there are limits to what this score represents).


As you can see from this link, the percentile above was calculated using 6 SNPs.  Nebula predicted that I had a homozygous variant for 1 SNP and heterozygous variant for 1 SNP (and reference genotypes for the other 4 variants).  However, all of these variants looked OK in my higher coverage Veritas WGS data.

I believe that I have been previously reported to be at higher risk for restless leg syndrome, but that might have actually been for deep vein thrombosis / venous thromboembolism in the earlier 23andMe reports (before the FDA required approval for a more select set of results).  I do sometimes have difficult sitting perfectly still at night.  However, this does't happen all of the time, and I have never been diagnosed by a doctor for having this condition.  So, I would currently lean towards saying that I don't have restless leg syndrome.

For the 2 sets of SNPs that I checked (for alopecia areata and restless leg syndrome), I also visualized my Genos Exome alignment.  However, most of the variants were not covered by sequencing of coding regions.

In general, the journals where these results are published may make some readers think the results are useful.  However, being able to publish a result in a prestigious journal doesn't mean the associations are predictive enough to be clinically meaningful.  Also, even with a more subtle association, being in a prestigious journal doesn't necessarily mean the result can be reproduced.  For example, there are retractions in high impact journals (you can see some in this blog post), and there are objectively wrong conclusions in papers that haven't been retracted (and the science-wide error rate is mentioned in this blog post).  I don't want to cause unnecessarily alarm, but I think it is important to emphasize that time and large sample sizes (and independent validation) are needed to become comfortable with using genetic results to guide your medical treatment.

Nebula does provide a warning: "Disclaimer: Nebula Library is for research, information, and educational use only. This information is not medical advice, nor is it intended to be used for any diagnostic purpose. Please seek the assistance of a health care provider with any questions regarding your health."  However, I think this is easy to miss and the importance may not be fully understood among all customers.

Additional Note #1: I tried to provide a review for Nebula on Trustpilot, but I have encountered some difficulties.  You can see a screenshot of the current review (that was not accepted) here.  While I still haven't gotten a response for the last attempt to submit a review and get an explanation of what I need to change.  While I am not certain if this is the cause, the link that I received to submit a review initially created a review under another name.  To be fair, Nebula did pay me the $10 Amazon gift card (even when I provided a screenshot of a 2-star review, when most are 4- or 5-star reviews), and I hope that this review can eventually be posted (in which case, I will provide a link to that review, instead of this longer explanation).

Additional Note #2: You can see my report to FDA MedWatch (MW5093887) in MAUDE here.  I received an acknowledgement via mail for another report, but I just looked for this report after waiting a while.

Update Log:

8/4/2019 - public post date
8/5/2019 - add update about Nebula research library
8/6/2019 - minor changes
8/10/2019 - add link for 23andMe SNP chip versus WGS concordance
8/14/2019 - minor changes
8/15/2019 - minor changes; add box around APOE variant
8/16/2019 - minor changes
8/17/2019 - revise title (to better emphasize importance, but also presentation of just my own data)
8/16/2019 - minor changes
11/26/2019 - add arrows to Nebula samples in IGV screenshots
1/26/2020 - add screenshot of Trustpilot review
2/24/2020 - mention that Nebula is currently offering higher coverage sequencing
3/19/2020 - add concerns about Nebula Library (to match what I described in my MedWatch report)
3/20/2020 - add links to SNP details for selected library results
3/22/2020 - add link to other PRS post
4/18/2020 - add notes about checking RA post
4/24/2020 - add notes about FDA MedWatch submission
4/26/2020 - minor changes
7/6/2020 - minor changes "Polygenic Risk Score" label, for the last part of the blog post.
 
Creative Commons License
Charles Warden's Science Blog by Charles Warden is licensed under a Creative Commons Attribution-NonCommercial-NoDerivs 3.0 United States License.