Showing posts with label 1000 Genomes. Show all posts

Friday, July 3, 2020

Broad Ancestry Predictions for My Exome Sample

I had a supervisor ask me to help a co-worker with making some ancestry estimates in Exome samples.

I wanted to first test application to my own samples, which I thought could at least help with troubleshooting errors and providing another independent sample for comparison (not used for training the method being tested).

I also thought it might help to put this in a blog post, since I think this can provide a concrete example of what might help in working towards labs knowingly collaborate with each other (where large portions of work may otherwise be done in different labs without their each other's knowledge).

Strategy #1: Use On-Target High Coverage GATK Variants

Based upon some earlier analysis (related to the Mayo GeneGuide analysis, but not previously posted), there is some additional decrease in IBD/kinship from a perfect self-identification for my Genos Exome sample (even though I think it may still be acceptable for some applications, such as self-identification for QC and privacy purposes):

 Sample 1Sample 2 Kinship 
 Veritas WGS Genes for Good SNP chip0.499907 
 Veritas WGS 23andMe SNP chip0.499907 
 Veritas WGSMayo GeneGuide Exome+ 0.499907 
 Veritas WGSGenos Exome (BWA-MEM Re-Aligned, GATK Variants) 0.459216

As you can see in the above link, performance was better for the Mayo GeneGuide gVCF.  However, I was not provided FASTQ files or BAM files (even when I paid for the Exome+ data to get the gVCF), and Mayo GeneGuide has been discontinued (and I would usually have considered the Genos Exome to be preferable overall).  This may be because my Genos Exome target design was for CDS (protein-coding) regions only.

While it is impossible to conduct the 2nd strategy (using off-target reads) with the Mayo GeneGuide Exome+ data, I can test comparing the 2 Exome samples (Genos and Mayo GeneGuide) for ADMIXTURE ancestry analysis:


There is also public code written for a lab for QC Array (SNP chip) application, which is conceptually similar (although my 23andMe and AncestryDNA SNP chip IBD values were higher than my Genos Exome kinship values).  This explains the naming of the table with the 1000 Genomes super-population assignments (to create the ADMIXTURE .pop file).

There is also some code for the above ADMXITURE plots here.  Those results were roughly similar with all 5 of the samples tested (Veritas WGS, Genes for Good SNP chip, 23andMe SNP chip, Genos Exome, and Mayo GeneGuide Exome+) with 2,272 1000 Genomes reference samples and 9,423 genotypes.

For comparison, if I just compare my 23andMe SNP chip to the 1000 Genomes SNP chips (using an increased count of 92,540 probes), then this is what my ADMIXTURE ancestry looks like:


Strategy #2a: Use Off-Target Reads for STITCH lcWGS Analysis

For comparison, you can see this blog post about using lcWGS for self-identification (where ~1 million reads had similar performance to the Genos CDS Exome Kinship/IBD calculation).

This leads to some improvement in the kinship between my own samples (~0.479 compared to my 23andMe and AncestryDNA SNP chips).


This estimate is similar to the on-target results (~85% European ancestry).  However, my AMR percentage was higher (~7% versus <1%), and my EAS percentage was lower (~1% versus 7%).  So, I think this was a little more accurate, but I list some important caveats below.  However, if you are looking for 1 majority ancestry assignment (and placing less emphasis on <10-20% assignments), then they are essentially the same (and using STITCH considerably increases the run-time).

Importantly, you can also see my lcWGS ancestry analysis here (but for chromosome painting rather than ADMIXTURE, where chromosome painting requires more markers), and you can see my full SNP chip results (mostly for 23andMe) here.  So, I was a surprised that the larger number of 23andMe SNPs at the end of the 1st section didn't have an ADMIXTURE EUR percentage closer to 95% in the previous section (more similar to the chromosome painting results) and was even less accurate by that measure.  However, if you say that you can only consider individuals with 1 primary ancestry assignment with a >50% or >70% contribution (for me, EUR), then these results are all compatible.

On top of that, this is not really a fair comparison for ancestry, since the imputations were made using CEU, GBR, and ACB 1000 Genomes reference samples (the set of 286 reference samples used for IBD/kinship self-recovery).

In contrast, these are the results if I only use the GIH population samples as the reference for the imputations, and kinship similar decreases a little (~0.457) and this is what the supervised ADMIXTURE assignments look like (which introduces the expected bias based upon the reference population):


The run-time was also noticeably shorter when I used 1 population for imputation (versus 3 populations for imputation).

That said, if you had a more diverse set of samples to test, then that should also be taken into consideration.  For example, if I guessed the wrong ancestry for imputation, then that can cause some noticeable problems.

While it looks like STITCH off-target read analysis might provide improvement on first impression, the need to know the ancestry for a sample in advance confounds this particular application.  Namely, I would say this re-emphasizes that you need to be careful to read too much into the EAS versus AMR differences that I reported earlier, since I used the most relevant populations for myself and those results are therefore not completely unbiased (think of it like the opposite of the SAS/GIH imputation test).

I ended up using considerably fewer off-target genotypes than I was expecting (>50,000 bp off-target sequence), but you can see that  I did need to use more sequence (closer to the target regions) for the GLIMPSE analysis below.

Strategy #2b: Use Off-Target Reads for GLIMPSE lcWGS Analysis

In the lcWGS self-identification for my own sample, the performance of GLIMPSE was lower than STITCH, but the run-time was noticeably faster and all the 1000 Genome samples were used (so, it was not designed to use a subset of most related populations to improve performance).

Because the run-time was shorter, I tested multiple flanking distances from the coding regions.  This was important because I needed to use sequence closer to the target regions to get self-identification more similar to STITCH:

 Sample 1Sample 2 Kinship 
 GLIMPSE (Genos Off- Target)
50,000 bp flanking
 23andMe SNP chip0.362039
GLIMPSE (Genos Off- Target)
10,000 bp flanking
 23andMe SNP chip0.449494
 GLIMPSE (Genos Off- Target)
 2,000 bp flanking
 23andMe SNP chip0.475468


In all 3 cases above, the number of genotypes imputed by GLIMPSE was identical (91,296 variants).  Unlike STITCH, there was no "PASS" filter for these variants.  However, if this means that the variants were more accurate when more reads were used, then I believe the number of variants that would have had a "PASS" status should have also increased.

If you use the >10,000 bp and >2,000 bp flanking sequence, then you can see my ancestry results below (respectively):


I am not sure if it matters that  I had to use sequence closer to the target (coding) regions, but these look similar to the regular on-target variant ancestry results (which were not as computationally intenstive and took up less storage space).

You can also see some more details about the GLIMPSE analysis on my samples here.


Finally, this was my first attempt at estimating ancestry from my Exome samples, so I think that there is likely some room for improvement.  Nevertheless, I hope this is useful as a starting point for discussion (for what I thought was more-or-less the most straightforward application of existing methods).

Disclaimer: I think it is important to emphasize that this amount work may not be enough to say the strategy is completely free of errors, and it is also not enough to say the process should be scaled up for more samples.

However, if this post and the public GitHub code can play a similar role as a public lab notebook like the LOG.txt file for the RNA-Seq differential expression limits test, then that might help with communicating effort (and/or a partial contribution to a process, for both positive and negative results).

Change Log:
7/3/2020 - public post date
7/4/2020 - minor changes (including clarification of summary/discussion)
7/5/2020 - minor changes (including adding link to initialized GLIMPSE GitHub subfolder)
7/6/2020 - minor changes
8/1/2020 - add GLIMPSE results

Sunday, March 8, 2020

Testing Limits of Self-Identification / Relatedness using Genomic FASTQ Files

Color asked me sign a HIPAA release in order to get access to raw genomic data, which included a FASTQ file with ~15,000 reads.  So, I thought it might be useful to get an idea about how few reads (from random low-coverage Whole Genome Sequencing) can be used to identify myself.

To be clear, I think most rules are meant to take possible future advances into consideration.  So, just because I can't identify myself, doesn't mean somebody else can't identify me with fewer reads (with current of future methods).  Nevertheless, if I can identify myself, then I think that there is a good chance others could probably identify themselves with a similar number of reads and/or variants (and possibly fewer reads/variants).

Down-Sampling 1000 Genomes Omni SNP Chip Data

I compared relatedness estimates for myself with the following genotypes:  1) Veritas WGS, 2) 23andMe SNP chip, 3) Genes for Good SNP chip, and 4) Nebula lcWGS (along with the matching positions from the 1000 Genomes Omni SNP chip).

Perhaps more importantly, I also show kinship/relationship estimates (from plink) for 1000 Genomes samples for parent-to-child relationships as well as more distant relationships:


As you can see, there is a bit more variability in the parent-to-child estimates with a few thousand variants.  The self-identification estimates (among pairs of my 4 samples) were always greater than 0.45, but there is noticeable overlap in the kinship estimates for 1000 Genomes parent-to-child and more distant relatives when you drop down to only using 19 variants.

So, making sure you didn't get false positives for close relationships may be important, particularly with smaller numbers of variants.  If you have SNP chip or regular Whole Genome Sequencing data, then identifying yourself would also be easier than having 2 low-coverage Whole Genome Sequencing datasets.

However, if I can get 1000s (or perhaps even 100s) of variant calls, I am currently most interested in how accurate those calls can be.

Gencove and STITCH Imputed Self-Identification

I have earlier posts showing that the Gencove imputed variants from Nebula were not acceptable for individual variant calls, but I think they provided reasonable broad ancestry and relatedness results.  To be fair, I don't believe Nebula is currently providing low coverage Whole Genome Sequencing results anymore, opting for much higher coverage (like regular Whole Genome Sequencing).  However, Color provided me with considerably fewer lcWGS reads than Nebula (and Color also has a pre-print about lcWGS Polygenic Risk Scores that I was concerned about).

So, I was interested in testing what imputed variants I could get if I uploaded FASTQ files for Gencove analysis myself (as well as an open-source option called STITCH).


There is also more information about running STITCH (as well as more statistics for Gencove variant concordance) within this subfolder (and this subfolder/README) on the human GitHub page.  Essentially, the performance of the human lcWGS looks good at 0.1x (if not better than the earlier Gencove genotypes that were provided to me from Nebula), but there is a drop in performance with the cat lcWGS.

I ran the STITCH analysis on a local computer, so the run-time was longer than Gencove (between 1 day and 1 week, depending upon the number of reference samples - hence, I would start with running STITCH with ~99 reference samples in the future).  However, if you were willing to pay to run analysis on the cloud (or use more local computing power), I think the run-time would be more similar if each chromosome was analyzed in parallel.  Also, STITCH is open-source, and doesn't have any limits on the minimum or maximum number of reads that can be processed.  The performance also looks similar with ~5 million 100 bp paired-end reads, so the window for more accurate results that can be returned from Gencove may be around 2 million reads.  So, I think using STITCH can have advantages in a research setting.

I welcome alternative suggestions of (open-source) methods to try, but would tentatively come up with these suggestions (for 100 bp paired-end reads, with random / even coverage across the genome):

greater than 1 million reads: good chance of self-identification

0.1 - 1 million reads: intermediate chance of self-identification (perhaps similar to patient's initials, if it narrows down a set of family members?).  Potentially "good" chance of self-identification with other methods and/or future developments.

less than 0.1 million reads: respect general privacy and allow for future improvements, but additional challenges may be countered.  There still may also be sensitive and/or informative rare variants.

I also added the results for GLIMPSE lcWGS imputations (Rubinacci et al. 2020).  These are human results, but the performance was a little lower than STITCH (more similar to the Gencove results for my cat, but lower than the Gencove results for myself).  However, it probably should be noted that I did not specify my ancestry for GLIMPSE but I did specify a limited number of populations for STITCH.  So, if you don't know the  ancestry (or the ancestry used might  confound the results), then that loss of concordance may be  OK.  Also, I think the  GLIMPSE run-time was shorter (within 1 day) and it used the full set of 1000 Genomes samples as the reference set.

Recovery/Observation of Variants in 1 Read

Even if I don't exactly know what is most likely to be able to self-identify myself, I can try to get some idea of the best-case scenario in terms of even having 1x coverage at a potentially informative variant position.

The numbers here are a little different than the 1st section: I am looking for places where my genome varies from the reference genome, and I am considering a larger number of sites.  Nevertheless, I was curious about roughly how many reads it took to recover 500 or 1000 variants from a couple variant lists:


Notice the wide range of any SNPs that can be recovered versus a set of potentially informative SNPs.  However, it looks like you may very roughly notice problems with self-identification (for even future methods) with less than ~250,000 reads (matching the STITCH results above).  This is noticeably more than the ~15,000 of reads that I had to sign a HIPAA release to get from Color, but that lower limit (for any SNPs, called "WGS SNPs" with the gray line) was ~15,000 reads (very similar to what I was provided from Color, albeit single-end instead of paired-end).

In reality, you have sequencing error and a false discovery rate to consider when calling variants from 1 read, the nucleotide distribution at each position is not random between the 4 nucleotides, linkage (non-independence) of variants, and you have 2 copies of chromosomes for each position in the genome reference.  However, if you over-simplified things and asked how many combinations of 4 nucleotides (or even 2 nucleotides) create more unique sequences than the world population, that is noticeably less than the 500 or 1000 thresholds added to the plot above.

So, if you consider rare SNPs (instead of calculating a relatedness estimate, with common SNPs), perhaps you could identify yourself with less than 50,000 reads?  Either way, if you give some rough estimate allowing for future improvements in technology, I would feel safe exercising extra caution with data that has at least 100,000 reads (collected randomly / evenly across the genome).  I also believe that erring on the side of caution for data with fewer reads is probably wise as a preventative measure, but I think the possible applications for that data is lower.

Closing Thoughts

If anybody has knowledge of any other strategies, I am interested in hearing about them.  For example, I think there may be something relevant from Gilly et al. 2019, but I don't currently have a 3rd imputation benchmark set up.  I have also tried to ask a similar question on this Biostars discussion, since it looks like Gencove is no longer freely available (even though I was able to conduct the analysis above using a free trial).  I have all of this data publicly available on my Personal Genome Project page.

I am also not saying that it is not important to consider privacy for samples with less than any of the numbers of reads that I mention above (with or without a way to self-identify myself with current methods).  For example, the FASTQ files have information about the machine, run, and barcode in them (even with only 1 read).  So, if the consumer genomics company had a map between samples and customers, then perhaps that is worth keeping in mind for privacy conversations.  Likewise, if the smaller number of variants includes disease-related variants, perhaps that is also worth considering.

I don't want to cause unnecessary alarm: as mentioned above, I have made my own data public.  However, you do have to take the type of consent into consideration when working with FASTQ files (for data deposit and data sharing).  For example, you currently need "explicit consent" for either public or controlled access of samples collected after January 25th, 2015.

Finally, I would like to thank Robert Davies for the assistance that he provided (in terms of talking about the general idea, as well as attempting to use STITCH for genotype annotations), which you can see from this GitHub discussion.  I would also like to thank several individuals for helping me learn more about the consent requirements for data deposit.

Additional References

I am interested to hear feedback from others, potentially including expansion of this list.

However, if it might help with discussion, here are some possibly useful references:

Selected Genomic Identifiability Studies (or at least relevant publications):
  • Sholl et al. 2016 - Supplemental Methods describe using 48 SNPs to "confirm patient identity and eliminate sample mix-up and cross-contamination".
  • McGuire et al. 2008 - article describing genomics and privacy with some emphasis on medical records
  • Oestreich et al. 2021 - article generally discussing genomics identifiability and privacy
  • Ziegenhain and Sandberg 2021 - in theory, considers methodology to provide anonymized processed data.  I have not tried this myself, but this could at best maximize downstream analysis.  That might be useful in that it expands processed data that could be shared with caveats.  However, some things require accurate sequencing reads as unaltered raw data.  Modified sequences should not be represented as such "raw" data.
  • Wan et al. 2022 - article generally discussing genomics identifiability and privacy
  • Russell et al. 2022 - instead of sequencing coverage (such as in this blog post), this preprint describes the impact of the amount of starting DNA material on microarray genotyping for forensics analysis.
    • Kim and Rosenberg 2022 - preprint describing characteristics affecting identifiability for STR (Short Tandem Repeat) analysis
  • Popli et al. 2022 - a preprint describing kinship estimates in low coverage sequencing data (and the amount of data for relatedness estimates is the topic for most of the content in this blog post)
While related to the more general topic, I think the goals of Lippert et al. 2017 and Venkatesaramani et al. 2021 and are somewhat different than what I was trying to compare (including image analysis).

I also have some notes in this blog post, some of which are from peer reviewed publications and some from other sources (such as NIH and HHS website).  Again, I would certainly like to learn more.

In addition to the publications for STITCH/GLIMPSE/Gencove, other imputation / low-coverage analysis studies include Martin et al. 2021, Emde et al. 2021 and GLIMPSE2.  Hanks et al. 2022 also compares microarray genotyping and low coverage imputation to Whole Genome sequencing.  If it expected that low coverage analysis includes enough markers to be useful, then I think you are either directly or indirectly saying that level of coverage is sufficient to identify the individual (which I think is a criteria that is likely easier to meet than clinical utility).

I certainly don't want to cause any undue concern.  I think some public data is important for the scientific community, but I think it is appropriate for most individuals to agree to controlled access data sharing.  Nevertheless, I think this is an important topic, which might need additional communication in the scientific community.

Change Log:

3/8/2020 - public post
3/9/2020 - add comment about simplified unique sequence calculation
4/8/2020 - add STITCH results + minor changes
4/9/2020 - minor changes
4/16/2020 - minor change
5/1/2020 - add link for GLIMPSE (before analysis)
7/28/2020 - add GLIMPSE results
1/15/2023 - add additional references for other studies
3/16/2023 - add 48 SNP verification

Sunday, August 4, 2019

My Genome-wide, Broad-Level Super-Population Ancestry was Robust, but I Observed Some False Positives in Smaller or Specific Segments

You can get an idea of the specific (country) assignments for ancestry in the various sub-folders on GitHub as well as sometimes in reports that I uploaded to my personal genome project page.

First, the good news: most companies indicate that I am mostly of European Ancestry, which is correct.

Second, the mixed news: while there were some findings that were correct, I had concerns about emphasizing a non-trivial false positive rate for some of the more specific ancestry predictions.  For example, I respectfully believe it is inappropriate for 23andMe to encourage travel destinations based upon their ancestry results.

To some extent, the names themselves sometimes indicate a limit to precision.  For example, if the category is "British & Irish" or "French & German," then you already don't have 1 country for a travel recommendation.  While I do have both British and Irish ancestry (and accordingly, those have the best specific marker evidence), I am a little concerned about the basis of some of the more specific assignments that I currently see.  For example, does overall population affect the density of likeihood that I had relatives from London?  If so, I think that would be kind of like assuming I live in either LA or NYC because I am from the United States (technically, I do live in the greater LA area, but I was born in Cincinnati and raised in Atlanta - plus, I think this is probably sufficient to make my point).  Also, it looks like that density plot is somewhat contradictory with the marker status, even within 23andMe.

While this sort of thing may be hard to firmly prove (for example, convergence between companies does not necessarily indicate the result is accurate, which we saw in a different way for my cystic fibrosis result), I have examples of the sort of things which I did or did not consider to be accurate below.

While some of these could be correct, I think it may sometimes be best to think of them like "hypotheses".

Positive Examples of More Specific (Relatively Recent) Ancestry


  • AncestryDNA predicted that I had more recent relatives in Tennessee, which is correct (on my mother's side).  However, even that may have had some limits to precision, given that the 1925-1950 interval seems less relevant to what I know.
  • 23andMe predicted that I had relatives living in Kingston Parish less than 200 years ago.  This could be correct.  Based upon my other family members, I can tell that this comes from my father's side with a relatively robust prediction of ~2-3% African ancestry (with large segments on multiple chromosomes).
    • I thought I had heard that my Great-Great-Grandfather (my Grandfather's Grandfather) was supposed to have been born from family that moved from the Caribbean to the United States (but I don't currently have confirmation of that).  
    • I also have consistent reports of Y-chromosome lineage E-M123.  While I am not sure if that is completely consistent with what I have described above, the greater African ancestry could be coming from Great-Great-Grandfather's father's mother's side (and/or his mother's side).


Effect of Filtering 23andMe Ancestry for Results with Higher Confidence Threshold


  • While I believe the above explanation for my African ancestry is plausible, there were 2 other specific ancestry predictions that I didn't think were right (and, in fact, those could be filtered by increasing the confidence threshold to 90%)
23andMe V3 Chip Ancestry Results (3/21/2019, 50% Confidence)

23andMe V3 Chip Ancestry Results (3/21/2019, 90% Confidence)

As noted in the GitHub notes, the East Asian & Native American and South Asian results go away with the higher confidence threshold (90%, instead of the default 50%).

What is not as clear from the above plots is that I also have notes of my percent Scandinavian ancestry varying from 11% to 3% (both with the V3 chip, at various times), and this is something that I think should have been called "Broadly European" instead of being assigned to a country that I believe is incorrect).  Accordingly, my Scandinavian ancestry also disappears if I change the confidence interval.  For other 23andMe customers, note the pull-down in the upper-right of the above screenshots.  That is how you can get the more conservative predictions (even though, in my opinion, I think it should be the other way around, where you have to opt-in for more speculative results).

I can also perform chromosome painting re-analysis with RFMix with 1000 Genomes reference samples, which I have shown below:


The overall picture is still that I am of mostly European ancestry.  You now start to get some small SAS (South Asian) predictions, but I think this is consistent with my general suggestion that the smaller segments are more likely to be false positives.

Also, all the segments of African ancestry should be coming from my father's side.  So, even though I think the above plot is good for some sense of overall estimates (for large segments), there is some sort of issue with phasing for my large SHAPEIT/RFMix chr14 segments (all the red should be 1 of my 2 copies of Chromosome 14, similar to my 23andMe results).  However, to be fair, there are chromosome-discordant 50% confidence results in my 23andMe data (with the smaller segments on Chromosome 3), which are on the same chromosome for this particular SHAPEIT/RFMix result (although that may also vary with different random seeds on different days).

Going back to the official 23andMe results, I purchased an upgraded V5 chip, and you can see those results below.

23andMe V5 Chip Ancestry Results (7/11/2019, 50% Confidence)

23andMe V5 Chip Ancestry Results (7/11/2019, 90% Confidence)


You now get a East Asian and Native American segment that remains with the higher confidence threshold.  However, using the same rationale as the SAS RFMix segments, I think the 0.1% segment on chr3 (surrounded by regions that were filtered with the higher confidence threshold) should receive less emphasis based upon the size of the segment.  So, if you ignore that (or just look at the most common ancestry prediction), the results for the V3 and V5 chips are consistent with each other (and other companies) with the broad conclusion that I am of mostly European ancestry.

On the flip side, I should also have some Spanish ancestry, which I don't see with the 90% confidence threshold.  However, I can see that ancestry with 50% confidence on chromosome 3 - in fact, that segment is estimated to be larger (2.1% versus 1.3%) in a later ancestry estimate.  So, unless that ancestry is being represented in another way (defined less precisely), this could be an example of a false negative with the higher confidence threshold.


Free Alternate Ancestry Prediction Options


  • I describe these in more detail on the 1000 Genomes re-analysis page for my 23andMe data (on GitHub).  However, I provide the general links here:
  • Again, it might be possible to have a false positive from multiple programs.  However, I think it is an overall good thing that you have these free options for re-analysis available.


To be clear, I am defining a difference between ancestry and relatedness.  In 23andMe, these are even in different sections ("Ancestry" versus "Family & Friends").  As mentioned in another blog post (please scroll towards the bottom), I believe the close family predictions should be accurate (even though I got a weird result when I uploaded my 23andMe data to FamilyTreeDNA).

However, to be clear, I think "specific" closely related individual predictions should be accurate (and I could in fact verify predicted relatives up to the range of second cousin on 23andMe and AncestryDNA), and this is the different than the more distant "specific" country assignments.  This matches 23andMe's definition of a "close relative."  However, it is hard for me to assess the accuracy of the confidence estimates for increasingly distant "DNA relative" predictions.

Update Log:

8/4/2019 - public post date
8/6/2019 - minor changes
8/14/2019 - minor changes
8/15/2019 - mention issue of RFMix phasing for African ancestry
8/16/2019 - minor changes
9/15/2019 - change title to just refer to myself
9/16/2019 - add link about DNA.land
10/18/2019 - mention aunt with Turner Syndrome (later removed, along with entire section)
10/22/2019 - minor change
12/2/2019 - add links to inpute.me and MySeq
1/27/2020 - add note about Great-Great-Grandfather (later removed)
1/29/2020 - modify notes (based upon what I could verify, even though I will probably have more revisions)
2/1/2020 - further modify notes
2/2/2020 - further modify notes
2/4/2020 - modify content throughout post (including changing the name of the section related to changing the 23andMe confidence thresholds, as well as removing some other details and the section about my mom's chromosome X)
2/5/2020 - additional changes in wording
2/6/2020 - minor changes
3/10/2020 - minor change

Sunday, June 9, 2019

General Comments on Low-Frequency Variant / Sequence Filtering

In terms of general troubleshooting artifacts for low-frequency variants (for any data type), these are some things that I think may be worth taking into consideration:

1) Increased false positives for DNA-Seq variants at lower frequencies in normal controls

From my own publication record, I discuss this in Warden et al. 2014:

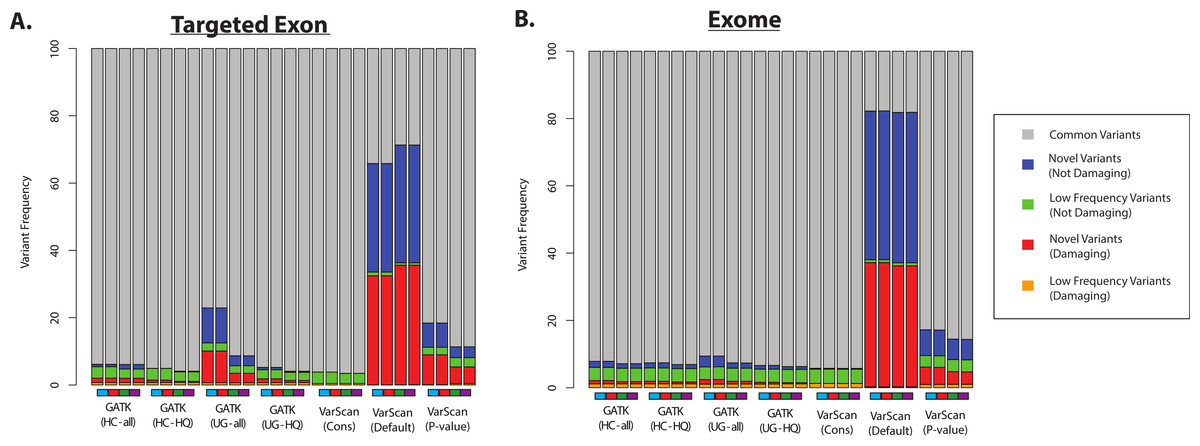
Namely, Figure 7 shows an implausibly high proportion of damaging variants with lower-frequency germline variants using VarScan with default settings (in healthy 1000 Genomes controls):


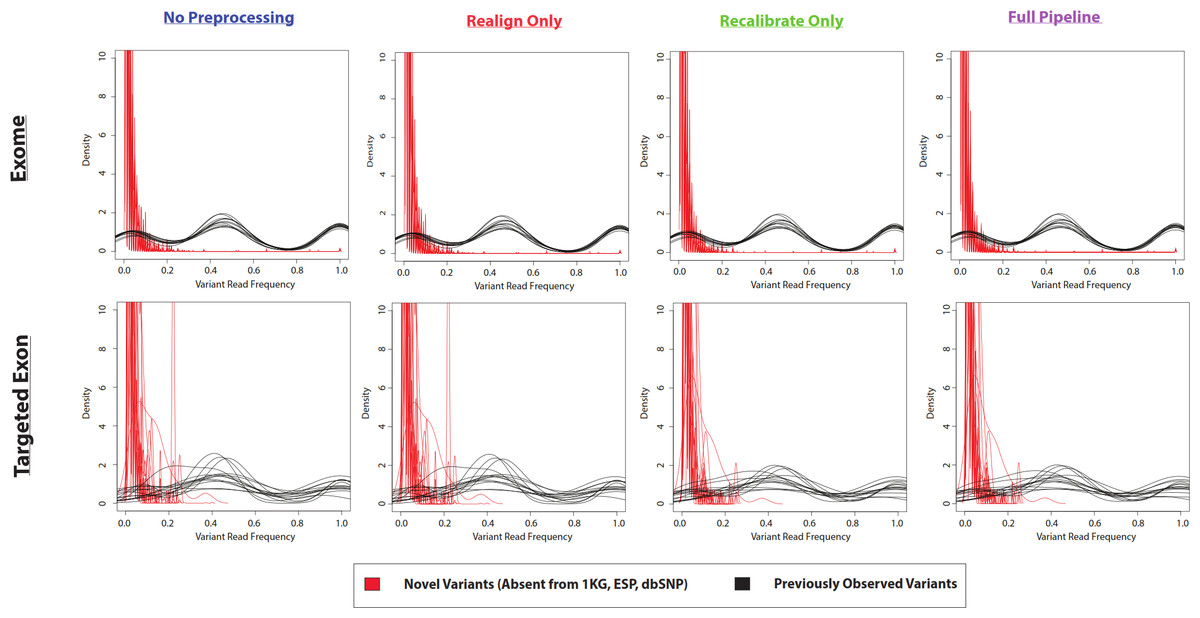
The variant frequencies (per sample, at a given variant position) are not immediately obvious from the above plot.  However, you can see those "novel" variants are more likely to be detected with the default settings in VarScan (Figure 4 of the Warden et al. paper):


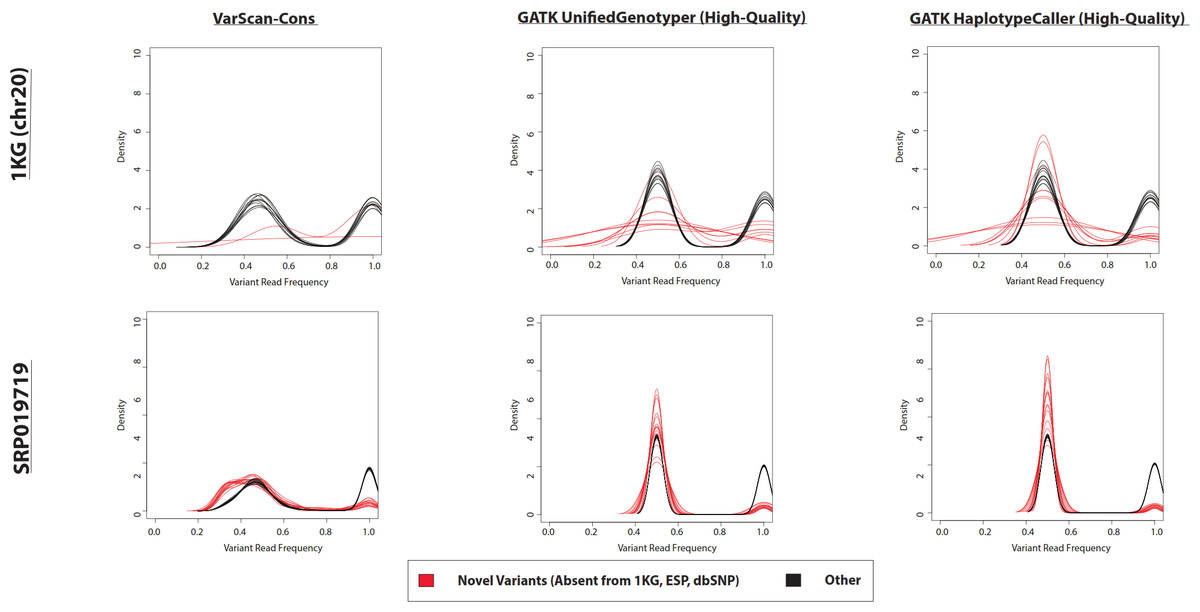
Although, importantly for this discussion, those variant calls can be improved with filtering.  Notice the "novel" and "known" variant frequencies are more similar, which is one of the indications in that paper of a lower false positive rate (Figure 5 of the Warden et al. paper):


In terms of other publications, you can also see increased discrepancies for low-frequency somatic variants (less than 20% variant fraction) in Arora et al. 2019 pre-print (in Figures 5B and 5D), as well as Figure S1 of Yizak et al. 2019 (although the emphasis on RNA-Seq versus DNA-Seq data is a little different).

2) Possible barcoding issues, such as with PhiX sequence (which doesn't have a barcode and theoretically shouldn't be in any de-multiplexed samples, even though you usually see at least some PhiX reads).

For 2), I would be happy if this post got enough attention for people to be aware there is a non-trivial chance their top BLAST hit for a PhiX sequence could be incorrectly labeled as a 16S sequence.

While a little less clear, I also think there should be more post-publication review for this eDNA article, where I think the title is the opposite of what seems like the most parsimonious explanation.

I added this quite a bit after the original post.  However, to be fair, you may sometimes be able to get some idea about barcode hopping if you have a small fragment (where you actually sequence the barcodes past your genomic sequence).  This is what I did for my cat's basepaws sequence (~15X WGS): in that case, you could see some other valid Illumina barcode combinations among my reads, but it wasn't too bad.  I'm not sure if this could be more of an issue with the low-coverage sequence (less than 1x), but I have general concerns about that (for most applications, except broad ancestry or IBD calculations).

Update Log:
6/9/2019 - original public post
8/2/2019 - add link to basepaws script
8/9/2019 - replace GitHub link with blog post link
 
Creative Commons License
Charles Warden's Science Blog by Charles Warden is licensed under a Creative Commons Attribution-NonCommercial-NoDerivs 3.0 United States License.