Showing posts with label GATK. Show all posts

Saturday, August 10, 2019

Disqus / Twitter Follow-Up: Comparing My 23andMe SNP Chip Concordance with Different Veritas WGS files

I am mostly summarizing my points from the following Twitter discussion:

https://twitter.com/carolinefwright/status/1157219572514209792

The original intention was to add this as a comment in the Disqus comment in the original pre-print discussion.  However, I thought this was fairly long, and I wanted to be able to have a little more control over figure formatting.

For reference, I recommended taking a look at Illumina arrays in an earlier comment, and I mentioned there there are datasets with both 23andMe SNP chip data and high-throughput sequencing data (like myself).

As a success story, that comment was followed up on, and new data was added.  In particular, there was a plot of the error/discordance rate between my own 23andMe data and my Veritas WGS data posted on Twitter.

I think this is great, but I think it may be worth emphasizing that re-processing my Veritas WGS data resulted in better concordance with my Exome data.  Additionally, I have an upgraded V5 chip, so there are actually 2 sets of 23andMe Data (although almost all of these results are based upon my later set of V3_V5 genotypes).

Nevertheless, I actually have 2 .vcf files for my Veritas WGS data (the provided .vcf, and the .vcf that I produced from extracted FASTQ files and reprocessed using BWA-MEM and GATK).

I did some analysis with my V3 23andMe genotypes, but I think that was mostly consistent with my V3_V5 genotypes.  Among probes on both arrays, there were only 5 discordant sites (so, I think that is how the previously lower error rate was reported: SNP chip versus same SNP chip, instead of SNP chip versus WGS).

In contrast, even the best-case scenario for my data seems to have concordance of 97.6-99.2% (with MAF > 0.01 variants), and this was slightly lower for the V3_V5 genotypes.  If I only considered my original V3 genotypes, this would have been better than I had previously reported for my Exome versus WGS data (98-99% for BWA-MEM + GATK re-processed variants).  However, either way, there are over a million probes on the V5 23andMe array.  So, I think something about variants being used for “research purposes” may be relevant (although I will show below that certain sets of variants do have higher reproducibility).

The trends can vary depending upon what I use for the MAF calculation:

1000 Genomes:


gnomAD:


Kaviar:


I am showing 2 plots each because I have 2 .vcf files for my WGS data (the one provided by Veritas, and the BWA-MEM + GATK re-processed variant file).  While the results are above are mostly similar with either Veritas WGS .vcf, there are some noticeable differences in the exact set of rare variants with different population estimates (which could either be because of the composition of individuals, or with the different sample processing strategies for each project).

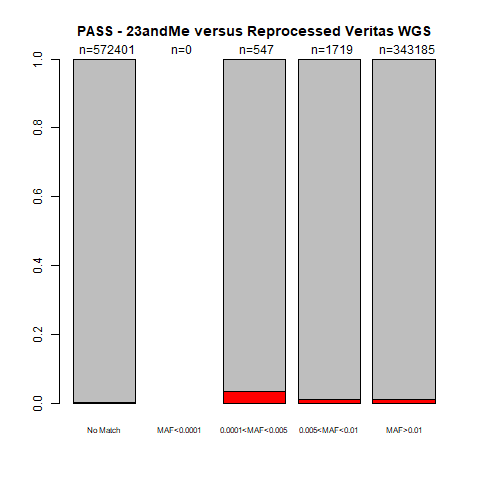
When I converted my 23andMe to VCF format, I added a “PASS” status (to keep track of variants within repeats, for example).  If there was no other note, the variant had a “PASS” in the FILTER column.  If I only consider “PASS” variants, this is what those plots look like:

1000 Genomes:


gnomAD:


Kaviar:


If I only consider the “PASS” variants, the accuracy also increases a little (from 98.8-99.7% for my initial V3 genotypes, and 98.009-99.997% with the range of MAF for my V3_V5 genotypes), usually in the far-left column.

Finally, if I start from the full set of variants, but I only look at those that were discordant between my WGS .vcf files, I see better concordance for re-processed variants if they are common (but the trend for the smaller variant sets can vary):

1000 Genomes:


gnomAD:


Kaviar:


For these plots, the largest number of variants are in the far-right column.  Since that far-right column usually has less SNP chip discordance (less red in the barplot), that is consistent with my earlier conclusion that re-processing the WGS data could produce variants with higher overall concordance (in that situation, between Exome and WGS data).  However, this can clearly vary between individual variants/positions (and the best processing strategy may vary depending upon where you need to be calling variants).

I can't really visualize the SNP chip data, and I kind of have to trust the "NC" status for "No Call" positions (and I don't have access to a more raw form of data, like the intensities).

However, as a general rule, I would always recommend checking your alignments for false negatives or false positives (which you can do with a free genome browser like IGV).  I added some ClinVar annotations to try and find some discordant sites to check, and I've listed a couple below:

1) I was surprised that my re-processed was missing my cystic fibrosis variant (which I have a whole other post about).  However, this was purely a formatting issue.

Namely, I threw out most indel positions (indicated by DI) because figuring out exactly what that represents is more difficult than for the SNPs.  However, with my earlier V3 chip analysis, I manually converted some indels in my code (including my cystic fibrosis indel).  However, I converted to match the freebayes indel format in the provided .vcf for the .

In the other blog post, you can clearly see that I am a cystic fibrosis carrier, even with the re-alignment.  So, I looked up the GATK format for that indel and checked the status of that variant.  Indeed, I do have a variant call for chr7 117149181 . CTT C.  So, this is in fact OK (as long as the annotation software can figure out I have the variant, which I think was part of the problem described in the other blog post).

2) While it wasn't a discordant site between .vcf files, there were only a limited number of total ClinVar pathogenic variants.  So, I happened to notice one that indicated I was homozygous for the pathogenic variant in my 23andMe data (1/1) but a variant was not called at that position with either of the Veritas WGS .vcf files (indicated by a 0/0 in the genotype columns).  In other words, the SNP chip data was consistent with a SNP chip replicate, the WGS variant was robust different processing methods, but the result was different for SNP chip versus WGS.

However, I can check the alignments for both the provided and reprocessed WGS data (as well as provided and reprocessed Exome data), which is what I do below:


The plot above shows alignments in the following order (top to bottom): Genos Exome Provided, Genos Exome Reprocessed, Veritas WGS Provided, Veritas WGS Reprocessed

So, from the alignments, I would be inclined to agree with the WGS variant calls.  If there is some isoform of the gene that is so far diverged the reads wouldn't align, that could be an exception.  However, I don't think that situation would be best described as a SNP.  Also, I don't believe any reports indicated that I had predisposition to Neurofibromatosis (and I don't know anybody in my family that was diagnosed with that disease).  This was a custom 23andMe probe (labeled as i5003284, instead of a typical rsID).  However, the larger ANNOVAR annotation file has the ClinVar information, and I can find a dbSNP ID using the UCSC Genome Browser (for hg19, chr17:29541542).  So, in terms of checking the ANNOVAR annotation, if I actually did have two copies of an NF1 pathogenic variant, rs137854557 does have multiple reports indicating it being pathogenic (less of a confident assertion than my cystic fibrosis variant, but more than most of my other "pathogenic" variants).

As a final note, the data and code for analysis of my V3_V5 23andMe genotype data (and 2 Veritas WGS .vcf files) is available here.

Update Log:

8/10/2019 - public post date
1/15/2020 - add tag for "Converted Twitter Response"

Sunday, June 9, 2019

Considerations for "Somatic Mutations Widespread Across Normal Tissues"

On Friday, the GenomeWeb summary titled "Somatic Mutations Widespread Across Normal Tissues, New RNA-Seq Analysis Finds" caught my attention.

I had to read the title a second time to realize that the Yizhak et al. 2019 article also mentions "normal" samples.  The reason is that Figure 1 shows tumor samples (and I would typically expect people to be using MuTect to be making somatic variant calls in tumors).

In terms of the tumor somatic variant calling (which is what I initially thought the article was emphasizing), something did seem strange about Figure 1A because (with rare exceptions) a true RNA-Seq mutation should also be present in paired DNA-Seq.  An important caveat is that the figure legend describes these as "mutations detected before filtering," but that is almost exactly what I thought may need to be made more clear in this blog post.

In fact, I was confused because Figure 1A is not the frequency of RNA-MuTect somatic variants calls.  I would have liked to see a similar plot after filtering, but they do say in the main text "to address the excessive mutations detected in only the RNA, we developed RNA-MuTect, which is based on several key filtering steps (fig. S3)...the vast majority (93%) of RNA mutations were filtered out".  In other words, the authors agree that Figure 1A indicates the presence of artifacts that need to be removed (and that the rationale for needing to develop their filtering process).

So, I agree with the authors more than I originally expected.  For example, what initially caused me the most concern is the use of the word "widespread" in the GenomeWeb summary that mentioned "normal" tissues.  However, the authors did not use the word "widespread" in their title.

Nevertheless, if there were parts of the article that confused me, then it may be confusing to other people as well.

In terms of things that you might generally need to watch out for, if you were working with a stranded RNA-Seq library, then you won't be able to correct for a strand bias (and they show a clear non-transcribed strand bias for the GTEx data in Figure S18).  Gene expression limits the ability to detect mutations, but you might also want to intentionally look for mutations retained in highly expressed genes.  Additionally, the title of the GenomeWeb summary reminded me of an RNA-editing paper that I am surprised hasn't been retracted yet (even though it had several published comments linked in PubMed and blog posts expressing concern). So, details regarding the alignment method, etc. are also important.

That said, Figure 2C makes me think there can be situations where even greater filtering may be worth considering.  For example, if one of the points of looking at RNA-Seq data is to look for variants that remained at high allele fraction (with the assumption that the cell could transcribe alleles/isoforms at different rates to decrease the allele fraction ;of the less advantageous allele), you may want to look for causal variants at greater than 20% allele allele fraction (in a pure tumor / disease sample).  Indeed, they explain the lack of validation for many DNA-Seq mutations as reduced detection in genes with low expression levels (where they cite calculations in Figure S2); However, to be fair, there are other sections of the article where I get the impression that variant fractions greater than 5% are thought to be more robust, which I agree with.

Nevertheless, to be clear, they already do noticeable variant filtering (described in the section "The RNA-MuTect pipeline" of the Supplemental Methods), which includes filtering of RNA editing sites.

Also, there are parts of the paper that use the term "pipeline," and I touch on the likely need to consider the default results as "initial" results that might require additional refinement (as a general rule) in this other post.  However, I think that is a broader issue to be communicated.

In terms of some specific comments for this paper:

a) I would have liked to see something like Figure 1A and Figure 2C for RNA-MuTect filtered somatic tumor mutations. However, I think some of this information is shown (per sample) in the bottom (and top) part of Figure 1C and Figure 4C.

Figure S5B is also somewhat similar to Figure 2C, although I believe the supplemental figure is specifically for variants related to those given signatures.

That said, while I am glad they used a conservative strategy overall, the variation in sensitivity / precision per-patient in Figure 1B makes me think RNA somatic variant calling still may require some optimization for various projects.

b) I believe there is a typo in Figure 1D (or at least the caption).  The caption makes it sound like the labels should be "Smoking UV APOBEC COSMIC POLE MSI W2".  However, I think the signatures are first defined from de-convolution, and then annotated.  This would explain how W2 is described as the APOBEC signature in the caption for Figure S5, while W2 is described as an RNA signature in the caption for Figure 1D (where APOBEC is described as W4).  Nevertheless, if W2 is supposed to be the 2nd row, that means that W2 should be described as (ii) rather than (vii) for the Figure 1D caption.


c) There is another typo in the main text:

Current: "Looking at tissue subregions, we found that non-sun-exposed skin had more mutations than nonexposed skin"

Corrected: "Looking at tissue subregions, we found that sun-exposed skin had more mutations than nonexposed skin"

d) I was a little surprised when 67 / 87 (77%) of rows in Table S6 were for DNMT3A (mostly at chr2:25468887), but I am guessing that is due to what was defined in the earlier list of 332 variants.  In general, prior knowledge for well-characterized variants may be preferable than filtering for discovery (for some situations), but I'm not sure what else to say about this specific result.

e) Please note that the scale of the y-axis is different within Figure 3C.

f) While I thought I remembered use of two alignments per sample, I am a little confused about part of the Supplemental Methods.

1. Mutation calling pipeline -- (2) realigning identified sSNVs with NovoAlign (www.novocraft.com) and performing an additional iteration of MuTect with the newly aligned BAM files.

3. The RNA-MuTect pipeline -- (3) A realignment filter for RNA-seq data where all reads aligned that span a candidate variant position from both the tumor (case) and normal (control) samples are realigned using HISAT2"

The code on-line uses HISAT2 for re-alignment (not NovoAlign).  I think the "Mutation calling pipeline" was upstream of "The RNA-MuTect pipeline"?  What could explain the difference in methods.  However, if the unfiltered set of calls is for the "Mutation calling pipeline," then that leaves a lot of false positives (that need to be filtered with something like the RNA-MuTect scripts).

Update (7/11/2019): During a journal club discussion, Integrative Genomics Core (IGC) staff helped me realize that the "1. Mutation calling pipeline" section describes both DNA and RNA-Seq data.  While the mixed sentences make it hard to follow, a possible explanation would be that Novoalign was used with the DNA-Seq data (and HISAT2 was used for the RNA-Seq data).  However, if that is true, then there should have been 3 categories in Figure 1A (DNA without filtering, DNA with re-alignment/filtering, RNA without filtering)

g) The main text describes a “yet unreported mutational signature in the RNA domainated by C>T mutations” (the majority of which were in a single colon cancer sample).  However, this seems quite similar to the oxoG artifact (Costello et al. 2013) that they describe filtering for the “RNA Mutation Calling Pipeline” (and the Haradhvala et al. 2016 8-oxoG pattern that they cite for the GTEx strand bias in Figure S18)

h) There is also at least one sentence that needs to be re-worded in the Supplemental Methods: "In comparison, RNA-MuTect that takes power into account and therefore can potentially results with a lower overlap (due to the lower number of powered sites out of total sites), achieves a median overlap of 10 mutations and an average of 18.6 mutations." (the tense / grammar is off)

i) I believe there is a typo at the top of Figure S3?  I thought the paired DNA was the validation, and I would expect most people would want to use RNA-MuTect for paired human tumor-normal RNA-Seq samples (not tumor RNA-Seq and normal DNA-Seq)

j) I believe the tissue-specific mutation hotspots in unaffected normals (Figure 4A) for skin and esophagus was not validated in the TCGA tumor cohorts for melanoma (SKCM) and esophageal cancer (ESCA) also did not have a row with the darkest red shade (for greatest mutation frequency)?

k) I believe there are 2 typos in the HISAT2 parameters (at least when using version 2.1.0)

Provided: l 0
Alternative: -I 0 (capital i, rather than lower-case l)

Provided: x 800
Alternative: -X 800 (capitalize x)

To be clear, I am certain that some somatic variants exist in normal tissues.  For example, the increased mutation rate in normal skin in Figure 2B (and otherwise low variant counts) made me more more comfortable with the normal tissue analysis.  However, I am saying such analysis needs to be careful about false positives and possible artifacts, and additional filtering on your own samples may be necessary (which, again, I believe the RNA-MuTect authors already agree with me on this issue, and that is why they developed their filtering strategy).

Also, it is my own fault that I didn't initially read to the end of the GenomeWeb article, where it was also mentioned "[we] expect that most of these clones would not ever become cancer."  I think that is important context to avoid alarm.  While I am glad that I took time to understand the article better on the weekend, I still have some room for improvement in terms of taking the right amount of time to develop an opinion / impression of a finding.

Finally, as kindly pointed to me, Science has an eLetters system (similar to the Disqus comment system).  I have pointed out the 2 most clear errors in an eLetter, and there is also another comment from another reader.

I also summarized some more general content that I decided to split into a separate post, but I think most of this content was more appropriate as a blog post than an in-article comment.

Update Log:

6/9/2019 - original public post
6/10/2019 - minor changes
6/18/2019 - add question / note on re-alignment method
6/28/2019 - update as I prepare for IGC Bioinformatics Journal Club presentation.  Fix some formatting issues introduced after that.
7/9/2019 - fix typo: Yizak --> Yazhak (I noticed this after a separate Disqus comment)
7/11/2019 - add note about mixed paragraph
7/12/2019 - add additional points i) and j) from yesterday's discussion
8/27/2019 - note expected typo for HISAT2 parameters in Table S12
5/1/2020 - minor changes + mention that Science allows published comments approved by the editors
5/15/2020 - add link to eLetter

General Comments on Low-Frequency Variant / Sequence Filtering

In terms of general troubleshooting artifacts for low-frequency variants (for any data type), these are some things that I think may be worth taking into consideration:

1) Increased false positives for DNA-Seq variants at lower frequencies in normal controls

From my own publication record, I discuss this in Warden et al. 2014:

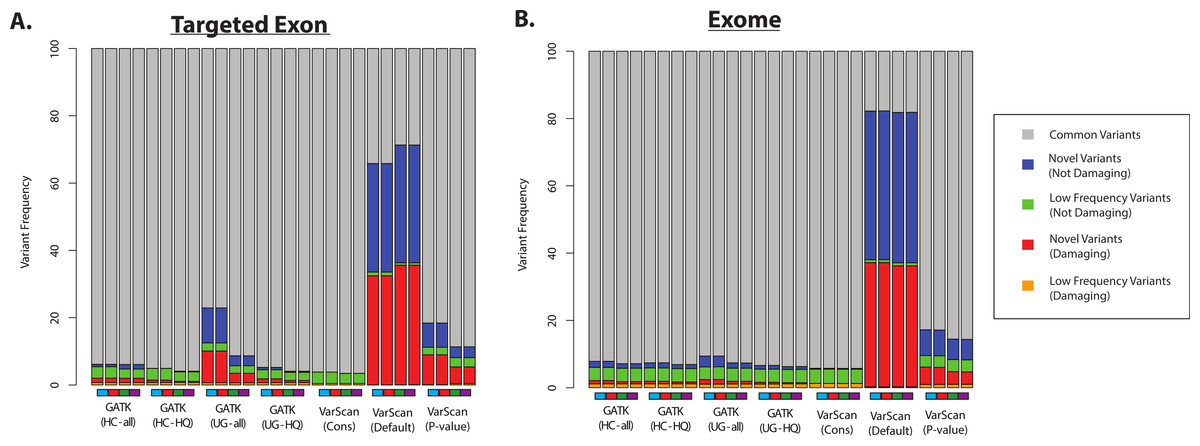
Namely, Figure 7 shows an implausibly high proportion of damaging variants with lower-frequency germline variants using VarScan with default settings (in healthy 1000 Genomes controls):


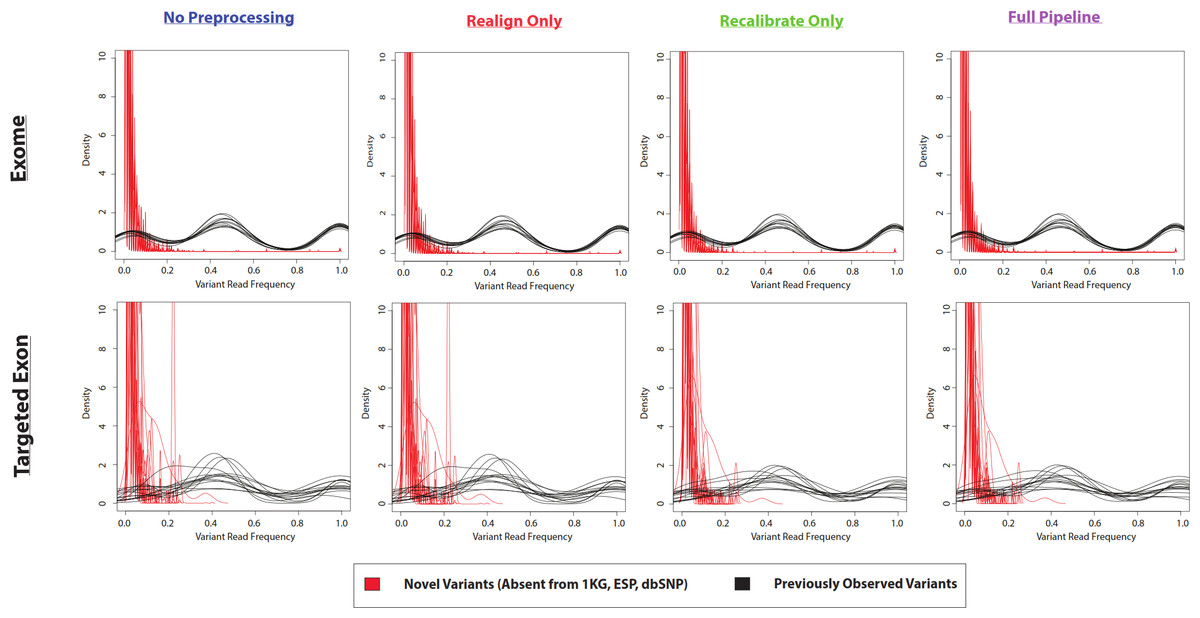
The variant frequencies (per sample, at a given variant position) are not immediately obvious from the above plot.  However, you can see those "novel" variants are more likely to be detected with the default settings in VarScan (Figure 4 of the Warden et al. paper):


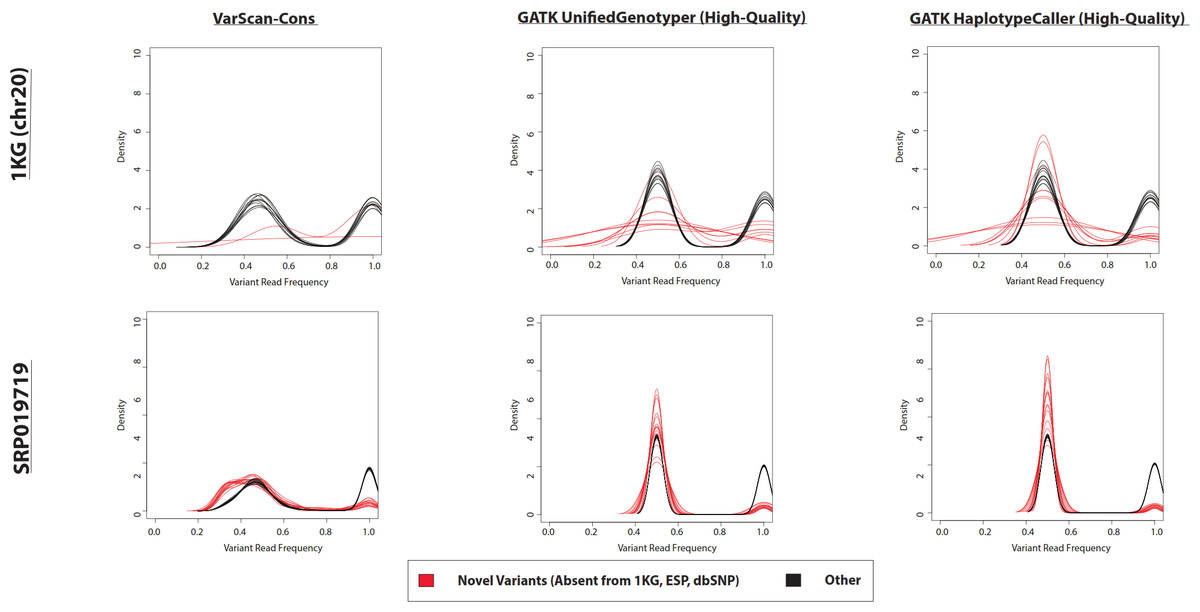
Although, importantly for this discussion, those variant calls can be improved with filtering.  Notice the "novel" and "known" variant frequencies are more similar, which is one of the indications in that paper of a lower false positive rate (Figure 5 of the Warden et al. paper):


In terms of other publications, you can also see increased discrepancies for low-frequency somatic variants (less than 20% variant fraction) in Arora et al. 2019 pre-print (in Figures 5B and 5D), as well as Figure S1 of Yizak et al. 2019 (although the emphasis on RNA-Seq versus DNA-Seq data is a little different).

2) Possible barcoding issues, such as with PhiX sequence (which doesn't have a barcode and theoretically shouldn't be in any de-multiplexed samples, even though you usually see at least some PhiX reads).

For 2), I would be happy if this post got enough attention for people to be aware there is a non-trivial chance their top BLAST hit for a PhiX sequence could be incorrectly labeled as a 16S sequence.

While a little less clear, I also think there should be more post-publication review for this eDNA article, where I think the title is the opposite of what seems like the most parsimonious explanation.

I added this quite a bit after the original post.  However, to be fair, you may sometimes be able to get some idea about barcode hopping if you have a small fragment (where you actually sequence the barcodes past your genomic sequence).  This is what I did for my cat's basepaws sequence (~15X WGS): in that case, you could see some other valid Illumina barcode combinations among my reads, but it wasn't too bad.  I'm not sure if this could be more of an issue with the low-coverage sequence (less than 1x), but I have general concerns about that (for most applications, except broad ancestry or IBD calculations).

Update Log:
6/9/2019 - original public post
8/2/2019 - add link to basepaws script
8/9/2019 - replace GitHub link with blog post link

Saturday, May 4, 2019

precisionFDA and Custom Scripts for Variant Comparisons

After posting this reply to a tweet, I thought it might be a good idea to separate some of the points that I was making about comparing genotypes for the same individual (from this DeepVariant issue thread).

For those who might not know, precisionFDA provides a way to compare and re-analyze your data for free.  You need to create an account, but I could do so with a Gmail address (and an indication that you have data to upload).  I mostly show results for comparing .vcf files (either directly provided from different companies, or created via command line outside of precisionFDA).

I needed to do some minor formatting with the input files, but I provided this script to help others to the same.  I also have another script that I was using to compare .vcf files.

For the blog post, I'll start by describing the .vcf files provided from the different companies.  If readers are interested, I also have some messy notes in this repository (and subfolders), and I have raw data and reports saved on my Personal Genome Project page.

For example, this is the results for the SNPs from my script (comparing recovery of variants in my Genos Exome data within my Veritas WGS data):

39494 / 41450 (95.3%) full SNP recovery
39678 / 41450 (95.7%) partial SNP recovery

My script also compares indels (as you'll see below), but I left that out this time (because Veritas used freebayes, and I didn't convert between the two indel formats).

I defined "full" recovery as having the same genotype (such as "0/1" and "0/1", for a variant called as heterozygous by both variant callers).  I defined  "partial" recovery as having the same variant, but with a different zygosity (so, a variant at the same position, but called as "0/1" in one .vcf but called as "1/1" in the other .vcf would be a "partial" recovery but not a "full" recovery).

You can also see that same comparison in precisionFDA here (using the RefSeq CDS regions for the target regions), with a screenshot shown below:


So, I think these two strategies complement each other in terms of giving you slightly different views about your dataset.

If I re-align my reads with BWA-MEM and call variants with GATK (using some non-default parameters, like removing soft-clipped bases; similar to shown here, for Exome file, but not WGS, and I used GATK version 3.x instead of 4.x) and filter for high-quality reads (within target regions), these are what the results look like (admittedly, using an unfiltered set of GATK calls to test recovery in my WGS data):

Custom Script:

20765 / 21141 (98.2%) full SNP recovery
20872 / 21141 (98.7%) partial SNP recovery
243 / 258 (94.2%) full insertion recovery
249 / 258 (96.5%) partial insertion recovery
208 / 228 (91.2%) full deletion recovery
213 / 228 (93.4%) partial deletion recovery

precisionFDA:


Since I was originally describing DeepVariant, I'll also show those as another comparison using re-processed data (with variants called from a BWA-MEM re-alignment):

Custom Script:

51417 / 54229 (94.8%) full SNP recovery
53116 / 54229 (97.9%) partial SNP recovery
1964 / 2391 (82.1%) full insertion recovery
2242 / 2391 (93.8%) partial insertion recovery
2058 / 2537 (81.1%) full deletion recovery
2349 / 2537 (92.6%) partial deletion recovery

precisionFDA:


So, one thing that I think is worth pointing out is that you can get better concordance if you re-process the data (although the relative benefits are a little different for the two strategies provided above).

Also, in terms of DeepVariant, I was a little worried about over-fitting, but that was not a huge issue (I think it was more like an unfiltered set of GATK calls, but requiring more computational resources).  Perhaps that doesn't sound so great, but I think it is quite useful to the community to have a variety of freely available programs; for example, if DeepVariant happened to be a little better at finding the mutations for your disease, that could be quite important for your individual sample.  Plus, I got a $300 Google Cloud credit, so it was effectively free for me to use on the cloud.

As a possible point of confusion, I am encouraging people to use precisionFDA to compare (and possibly re-analyze) new data.  However, there was also a precisionFDA competition.  While I should credit DeepVariant to cause me to test out the precisionFDA interface, my opinion is that the ability to make continual comparisons may actually be more important than that competition from a little while ago.  For example, I think different strategies with high values should be comparable (not really one being a lot better than the others, as might be implied from having a "winner"), and it should be noted that that competition focused on regions where "they were confident they could call variants accurately"  Perhaps that explains part of why the metrics are higher than my data (within RefSeq CDS regions)?  Plus, I would encourage you to "explore results" for that competiation to see statistics for subsets of variants, where I think the func_cds group may be more comparable to what I performed (or at least gives you an idea of how rankings can shuffle with a subset of variants that I would guess are more likely to be clinically actionable).
 
Creative Commons License
Charles Warden's Science Blog by Charles Warden is licensed under a Creative Commons Attribution-NonCommercial-NoDerivs 3.0 United States License.