Showing posts with label Polygenic Risk Score. Show all posts

Thursday, December 5, 2019

PRS Results from my Genomics Data (mostly from impute.me)

I haven't had a whole lot of personal experience with Polygenic Risk Score (PRS) estimates, so I thought it was interesting when I found a couple options for re-analysis of my own genomics data (for selected examples):

Association SNP chip
(impute.me)

(Folkersen et al. 2020)
Other
Re-Analysis Options
23andMe Results
Type 2 Diabetes
(No)
(Type 2 Diabetes, 146 variants)

Average / Above Average
(23andMe-V3, 12/19)

Average / Above Average
(AncestryDNA, 12/19)
MySeq

1.000 risk ratio [error]
(Nebula lcWGS)

0.955 risk ratio
(Genos Exome, 3 variants)

1.089 risk ratio
(Veritas WGS, 6 variants)
"Typical Risk" of 23% (directly from 23andMe, PRS with 1,244 loci)
[actually, slightly lower than normal]

Reduces to less than 1% when age, height, weight, fast food consumption, and exercise rate are taken into consideration (also from 23andMe)
Ulcerative Colitis
(once, so I think really "no")
(23 variants, and 116 variants)

Both Below Average and Above Average Risk, for different PRS
(23andMe-V3, 12/19)

Both Below Average and Above Average Risk, for different PRS
(AncestryDNA, 12/19)
Anxiety Disorder
(Yes, but getting better)
(6 variants)

Average / Above Average
(23andMe-V3, 12/19)

Average / Above Average
(AncestryDNA, 12/19)
Migraine
(Periodic)
(26 variants, and 21 variants)

2 PRS (Average and Above Average)
(23andMe-V3, 12/19)

2 PRS (Average and Above Average)
(AncestryDNA, 12/19)
Eye Color
(Light Brown)
DNA.land

Likely to have Brown Eyes
(23andMe-V3, 12/19)

Likely to have Brown Eyes
(23andMe-V3_V5, 12/19)

Likely to have Brown Eyes
(AncestryDNA, 12/19)
23andMe reports that I am expected to have "brown or hazel eyes" based upon 1 SNP (rs12913832)
Hair Color
(Light Brown)
See Below

(Roughly 25% Red and 50% Blonde)
For "Light or Dark Hair", 23andMe reports that I have "Likely Dark" Hair (using 42 SNPs)

For "Red Hair" 23andMe reports that I am "Unlikely to have red hair" (using 3 MC1R SNPs: rs1805007, rs1805008, and another custom MCR1 probe)
Height
(180 cm)
See Below DNA.land

171 cm: "Likely Taller than Average"
(23andMe-V3, 12/19)

171 cm: "Likely Taller than Average"
(23andMe-V3_V5, 12/19)

171 cm: "Likely Taller than Average"
(AncestryDNA, 12/19)

Individual SNP risks were reported (from impute.me).  While I had a bit of a hard time finding the precise overall risk estimate (without trying to sum / multiply separate risks), this might be OK in terms of getting a sense of whether I was an outlier or not.  For example, being above or below average for "Type 2 Diabetes" seemed to vary (unless you say most people were under something like a null distribution for "average" risk).  In other words, I thought the following plots (which you could see for various traits) were interesting:

impute.me Type 2 Diabetes PRS (23andMe V3)


impute.me Ulcerative Colitis (1st entry, 23andMe V3)


impute.me Ulcerative Colitis (2nd entry, 23andMe V3)

impute.me Anxiety Disorder PRS (23andMe V3)

impute.me Migraine-Broad PRS (23andMe V3)


impute.me Migraine PRS (23andMe V3)

impute.me Hair Color (23andMe V3 + Ancestry DNA, respectively)


impute.me Height (23andMe V3)


I thought the anxiety disorder result was interesting for 2 reasons.  First, I have had issues with anxiety problems (for example, you can click here for notes, even though they are primarily related to PatientsLikeMe).  Second, notice the environmental component is larger than the genetics component.  This matches my concerns that I expressed in this review of "blueprint".  For example, I would say the predictive power from birth has some notable limitations (such as difficulties in the need to take medication at any given point in your life).

While I am not sure if the exact right term was used (since I thought "Ulcerative Colitis" was a condition, rather than a symptom).  However, I was hospitalized for Ulcerative Colitis (even though that was a one time occurrence caused from E. coli with Shiga toxin).

I also get migraines.

I don't have Type 2 Diabetes, but I provided that because I also had other PRS results to compare.  Similarly, if others have suggestions where I can quickly compare to the impute.me PRS results, please let me know and I would be very happy to add them!

For example, I did add DNA.land (and 23andMe) Eye Color and Height based upon a Twitter response.  While I think height is one of the more heritable traits, DNA.land couldn't guess my actual height within a few inches (and there is a noticeable spread of points for the impute.me plot above).  Even though DNA.land gave lower confidence to other predictions, I would say these have been "fair" rather than "high" confidence (and everything else probably should have been "low" confidence).  I am close to the diagonal for the impute.me plot, but I don't know if the scale is 1:1.  For example, my DNA.land height prediction was off by 3-4 inches.  However, to be fair, note that the highest and lowest percentiles for high don't have overlap (there are not any points in the upper-left or bottom-right regions of the scatter plot, even though those make up a smaller fraction of the population).

For comparison, here is the distribution of score for DNA.land (where my true height was greater than anything on the density distribution - perhaps because this was height scaled for female percentiles?):


For impute.me, the predicted hair color shows blondness on the x-axis and redness on the y-axis.  The cyan circle is my actual color (which I filled in), and the while circle is my predicted color.  I think my hair color used to be lighter than it is now (and I think the shade that I reported for myself was a bit too dark), so that is closer to the genetic prediction (perhaps half-way between).

It may be worth noting that 23andMe could predict that I had brown hair and eyes (although I think that covers most people and you need the more rare traits to better calculate accuracy - for example, Francis Collins said that his 23andMe report indicated he had brown eyes when he really had blue eyes, at least 10 years ago).

Again, for comparison, here is the distribution of DNA.land scores for eye color:


I didn't add the AncestryDNA density plots since they looked qualitatively similar to the 23andMe V3 plots (and, on another computer, I had an issue with the percent variance explained appearing in a pie chart that was harder to read).  I also originally intended to test my updated 23andMe genotypes (V3+V5), but I got an error saying that data was already uploaded (from my V3 chip).  However, perhaps I can test those results later, and see if they are still similar.

With a $5 donation, the turn-around time for processing was 1-3 days.

For Genos Exome and Veritas WGS data, I used the BWA-MEM Re-Aligned GATK Variant calls.  However, I think the main conclusion from looking at my diabetes results was that I was of average risk, and I don't believe my own genetic diabetes PRS risk assessment was great without taking additional factors into consideration (for 23andMe, that was a difference between 23% and 1%, after considering BMI, diet, and exercise).

This essentially matches Supplementary Figure S12 for this paper (whose title I respectfully believe can give the reader the wrong impression, and there is at least one objective error that I believe needs to be corrected), where absolute risk explained was usually very low (usually explaining less than 15% of the variation for a trait).  You can also see that the variability explained by "this score" for the impute.me PRS above is estimated to be less than half of the genetic component.

I think the preprint by Brockman et al. 2021 might also have some additional relevant information for this discussion.

In somewhat different contexts, you can also see some notes / concerns about percentiles / indices in the posts on Nebula and basepaws lcWGS results.

Change Log:

12/5/2019 - public post
12/7/2019 - add DNA.land results based upon Twitter reply from Debbie Kennett; revise wording in post
12/8/2019 - mention possible scaling for female height; also fix date for previous log entry.
6/25/2020 - add links to posts with Nebula and basepaws results.  Minor formatting changes.
7/7/2020 - add reference to impute.me paper
4/22/2021 - add reference to another paper
2/4/2024 - change column labels to be more precise

Saturday, September 7, 2019

Book Review for "Blueprint"

Update (10/1/2019): If you would like to read a shorter review that shares my main overall opinions, please check out this.

Otherwise, there are some additional points being made in this blog post, which I think still has some value.

First, I think this book was very helpful in terms of critically assessing plots for Polygenic Risk Scores (PRS):

I had a bit of difficulty finding matching public images that I can post here, and I don't think there is a public interface (kind of like data.color.com; or some of the PGC data and/or the UK Biobank, even thought I had an issue with this link more recently) to query the TEDS data (or CAPS data, WTCCC data, etc.).  However, I would be very happy if somebody could how how a non-scientist can reproduce the results from the book.

Nevertheless, Figure 2 in Chapter 2 (page 25 in the paperback edition) shows scatter plots for weight where monozygotic (MZ) twins have a correlation of 0.84 and dizygotic (DZ) twins have a correlation of 0.55.  I think having concrete examples to show the spread of these correlations (which directly relate to heritability values in this book, defined as 2 times the difference between MZ and DZ correlations on page 27 in the paperback edition) is very important.

Scatter plots can also be important for interpretation.  In an earlier version of this blog post, I had a plot of ranks from here, but I noticed more recently that the linked image was not appearing in the post.  So, I kept searching, and I found some data from this post.  Using code that I uploaded here, I created the following plots for BMI correlations for  MZ versus DZ twins:


You can clearly see that the correlation is higher for twins that are 100% identical (MZ) versus 50% identical (DZ).  However, importantly, the ability to predict a BMI for an individual twin also has limitations.  The first row shows all points, and the second row uses the same data but provides a density distribution to see where a lot of points are close together.

You might also notice that the correlation coefficients are both lower than mentioned in Blueprint: as much as possible, I hope independent validation in multiple large cohorts is helpful, and transparency in data and sample section/filtering is also important.  However, at the current time, I am not sure what explains the difference in correlation coefficient, even if both datasets come to the same conclusion that the genetic impact is higher for monozygotic twins than dizygotic twins.

In the context of a Polygenic Risk Score, creating a scatterplot between the true value and the predicted value may also be helpful in interpreting and critically assessing the results.

In terms of an introduction, I think Chapter 12 (The DNA fortune teller) is quite good in terms of explaining how PRS are calculated and presented (although I kind of whish it was called something different, like "Introduction to Polygenic Risk Scores," since the main thing that was clear to me was the limitations and that seems strange for something called a "fortune teller").  For example, that chapter says "[the] most predictive polygenic risk score so far is height, which explains 17 per cent of the variance in adult height" (emphasis added, page 139 in paperback edition) as well as showing a scatterplot for actual height versus PRS for height (Figure 5, page 142, paperback edition), and Robert Plomin specifically has an actual height at the 99th percentile but a PRS for height in the 90th percentile (as a sort of "best case scenario" for a PRS).

Similarly, the Plomin's PRS for BMI was at the 94th percentile, while his actual BMI was at the 70th percentile (page 146, paperback edition).  He explains this in terms of being at the 99th percentile for height and possibly having to take extra effort to keep off weight (which I think sounds like a plausible combination of factors, in addition to general limits to predictive power).  If most people consider this as a motivating factor (similar to the author), perhaps that is good.

I also really like that Plomin gives examples of PRS percentiles for himself (Figure 11 on page 160, paperback edition): 22% for bipolar disorder, 35% for major depressive disorder, 39% for Alzheimer's disease, 85% for schizophrenia, and 94% for educational attainment.  That said, while I think some of his "self-understanding" discussions about his schizophrenia PRS may be acceptable in a research setting (page 151 and 177 in the paperback edition), it sounds like 85% is not a high enough score to be relevant in a clinical setting (if something like the PRS could increase the chance of somebody being institutionalized with less direct evidence).  This kind of makes sense for a disease with less than 1% prevalence, although I think that does bring into question the value of using common variants (instead of rare variants) in the PRS calculation.

Another useful plot is density plots for extreme values (with the range and overlap of PRS values for each of those populations.  Again, I am trying to show you something in the book without copying it, but I can make some representative examples in R:


For example, I would say the simulated example on the left looks good, but the utility of the example on the right could be questionable (although I think this is encountered more often, especially if you took a randomly selected trait and your own generated PRS).

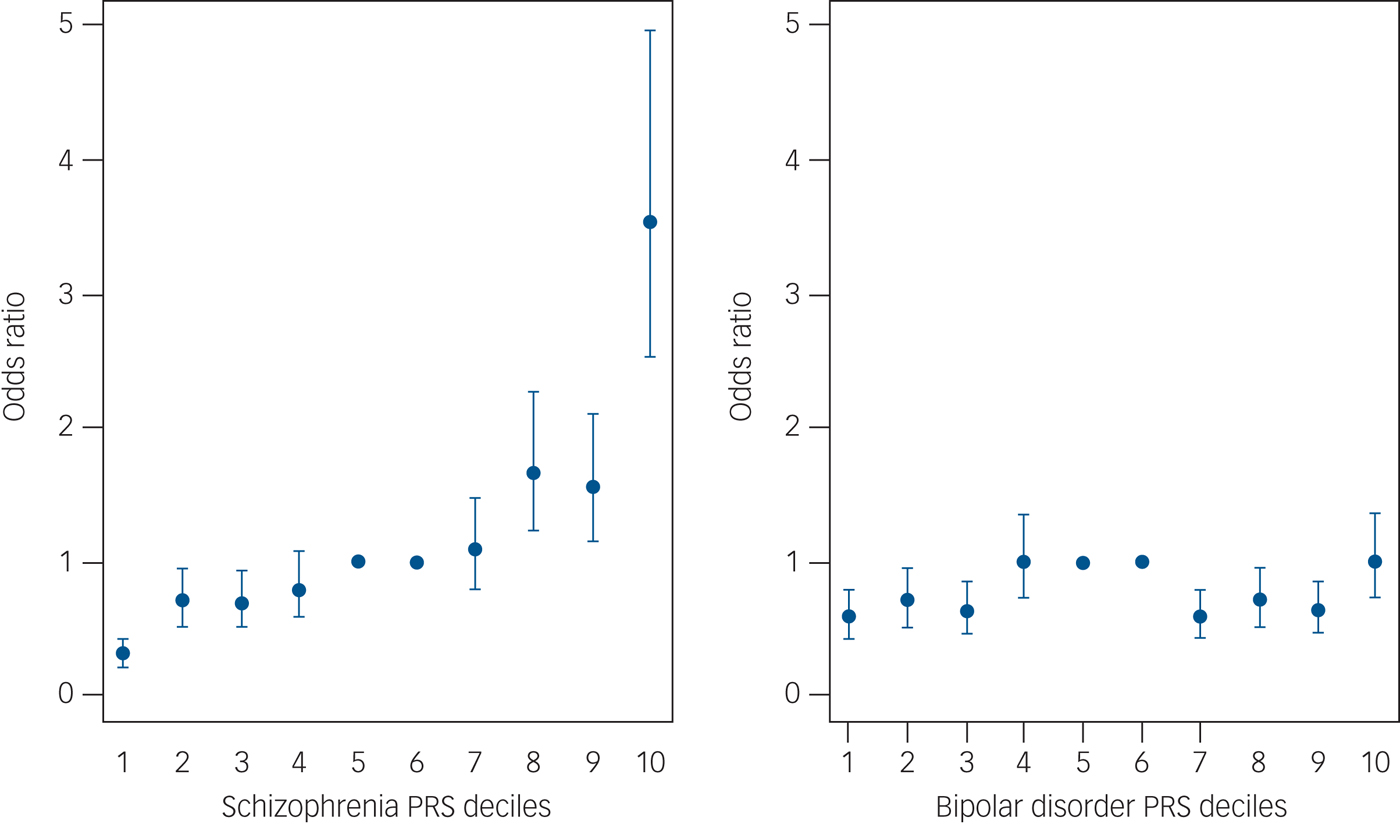
On the other hand, what I thought could be misleading was the decile plot shown in Figure 6 on page 144 in the paperback edition.  Yet again, I'll use an example on-line (from Figure 3 of Calafato et al. 2018, instead of in the book).  However, one of my top Google searches happened to be for psychiatric traits (rather than height as a positive example):


To be fair, this does make the schizophrenia PRS look like it may have some value with a percentile  >90% (matching the expectation not too much should be read into for the 85% PRS for the author), and it looks like the bipolar PRS is probably of limited utility. Nevertheless, you might have something that is not very predictive (with a lot of variability in the scatter plot) in a decile plot that looks like the 1st 9 deciles for schizophrenia (in that paper).

While I think the example with height was meant to give some sense of an inflection point above the 80th percentile, I think this does not do a good job of capturing the variability that you would see in a scatter plot (so, I think showing a scatter plots and density plots should be required for any PRS).  In particular, I believe the crucial point is made by Plomin on pages 143-144 (emphasis added): "The line running through each data point [in the decile plot] is called the standard error...Note that the standard error refers to the average of each group, not the error of estimating an individual's score...It does not mean that the actual height of 95 per cent of individuals in the top decile of polygenic scores will be in this range."

Second, I admittedly started the book with a bit of a negative impression - the prologue mentions predicting depression (and schizophrenia / school achievement) "from the moment of your birth, it is completely reliable and unbiased - and it costs only £100" (page vii, paperback edition).  As somebody who has had to manage anxiety and depression, I know that symptoms are context-dependent and change over time.  So, even without taking limitations to the genomics predictions into consideration, I would say that something like "probability of having at least 1 depressive episode" likely has a genetic component, but whether or not you have depression / anxiety at any particular interval (and whether or not that requires medication) will require additional factors.  In other words, I think there are a lot of exceptions to the assumption "[psychologists] study hundreds of traits, which is their collective label for differences between us that are consistent across time and across situations" (page 3, paperback edition).

I also don't believe I completely agree with the claim "[for] the first time, genetics offers a causal basis for predicting disorders rather than waiting until symptoms appear and trying to use these symptoms, rather than causes, to diagnose disorders" (page 66 in the paperback edition).  For example, I believe I even had a psychiatrist who explicitly said that getting caught up on the names for the diagnosis can sometimes cause problems beyond trying to treat symptoms.  However, I do agree that "[whether] you become anxious or you become depressed is caused by environmental factors" and I believe there is some useful insight in terms of clustering "internalizing problems" and "externalizing problems" (both on page 67 in the paperback edition).

Additionally, I think there is an important point being made about continuous traits and PRS values on page 164 in the paperback edition: "A second way in which polygenic risk scores will transform clinical psychiatry is by moving away from diagnoses and towards dimensions.  One of the big findings in this book is that the abnormal is normal, meaning that, from a genetic perspective, there are no qualitative disorders, only quantitative dimensions".  So, practically speaking, on the trait side, there are certain thresholds for needing to take action (such as not being able to function at work, at least without treatment / adaptations).  Likewise, I believe you still need concrete examples of less severe behavior to watch out for, in order to possibly identify problems early and prevent progression.

I certainly hope that there can be ways to better identify problems at an early stage in order to have the sort of prevention described on page x (of the paperback edition), but I think it is also important to be realistic about predictive power.  In other words, if the true predictive power is lower than you expect, then providing a diagnosis based upon DNA sequence alone (at least using one strategy of interpretation) might contribute to unnecessary stigma for a patient.  Given the prevalence of depression, I think there are a number of things that probably should be done to improve perception of mental illness (so, a false positive would be less of a big deal).  However, I would be more concerned if limits in predictive power were not properly understood in situations where a false positive could negatively impact the rest of a person's life (if we assume a person will have a severe mental health problem, without any evidence from their actual behavior).  So, it is the part about "This means that we can foretell our futures from birth.  For example, in the case of mental illness, we no longer need to wait until people show brain or behavioral signs of the illness and then rely on asking them about their symptoms" (emphasis added, page x of my paperback edition) that I think is either not being commentated precisely (especially in the present tense) or causes me concern.

To be fair, I have general experience with genomics research (and personal experience with mental health problems), but I didn't have any previous psychiatry research experience reading this book.  So, what may very well be true is that the genetic predictors are better than other risk factors.  For example, Plomin says "[there] are very few large effect sizes in psychology.  On example is that general intelligence accounts for about 25% of variance in educational achievement." (page 31, paperback edition).  However, I think it is also important to keep in mind how the predictive power for these traits / illnesses compares to other associations, and there is still a need to fairly judge each situation independently.

In other words, before reading this book, I thought I mostly remembered schizophrenia having the least significant association.  For example, in Selzam et al. 2019 (with Robert Plomin as the last author), the Polygenic Risk Scores in Figure 1 had significantly higher beta coefficients for height and BMI (or the other cognitive traits) than schizophrenia (SCZ), which was opaque in the lower-right because it's own p-value was greater than 0.01 (and the difference is indicated as not being significant).  Likewise, this review concluded "[these] limitations mean that [Polygenic Risk Scores] are not yet clinically useful in psychiatry."  The book itself also describes limited success for psychological disorders in a 2007 study, although studies with even greater sample sizes were emphasized after that (such as from the Psychiatric Genomics Consortium).

However, to be fair, the Figure 1 in the PRS paper linked above does show better success in predicting educational attainment (General Certificate of Secondary Education, GCSE, in that paper).  While I don't discuss it much in this post, this is a topic of discussion in multiple chapters of the book.  As yet another way to compare PRS, the Epilogue of the book (on page 187 of the paperback edition) summarizes: "polygenic scores...can predict 17 per cent of variance in height, 6 percent of variance in weight, 11 per cent of the variance in school achievement, 7 per cent of the variance in intelligence, and 7 per cent of the variance in liability to schizophrenia."  However, I was less impressed with Figure 10 density plots on page 158 of the paperback version of the book (showing density distributions for the top / bottom 10% of educational attainment PRS, as a function of GCSE score percentile), so perhaps the lower values than Height or BMI for the beta coefficients in the paper should also be emphasized (and, while I think the paper seems to be a better match to my expectations, I don't believe this is entirely consistent with the relative percent variance explained in the Epilogue of the book).

Outside of the book, I did stumble across a gene that was specifically named because of it's association with schizophrenia (DISC1, although that might have been from the NCBI entry for mouse name for Disc1).  However, it is probably also helpful to have numbers like "if one sibling is diagnosed as schizophrenic, their siblings have a 9 per cent risk of being schizophrenic, much greater than the rate of 1 per cent across the general population" (emphasis added, page 71, paperback edition).  In that situation, there is considerably increased risk, but predictive power is still low.  Likewise, I have concerns that the reader may over-estimate the predictive power from sentences like "[for] schizophrenia, DNA differences packaged as polygenic risk scores are now the best predictor we have for who will become schizophrenic"(page 126 in the paperback edition), even though that may in fact be true (and the predictive power for other traits / risk factors is just worse).

There was also at least one paper that indicated "twin studies [can overestimate] heritability," and my comment on that paper references a pre-print where it looks like varying definitions of heritabilty can be used (between the twin 2*|corMZ - corDZ|)  I also noticed that the MaTCH entry for cystic fibrosis (under "ICF/ICD10 Subchapter") wasn't especially high; I'm not sure if that is an issue with sample size, but that makes me think this measure may not be absolutely perfect in terms of representing how well we understand the biology of a given disease (or the severity of the rare disease).  I also thought it was strange that the dizygotic twin correlations were higher than the monozygotic twin correlations for cystic fibrosis.  Perhaps I should look more into the associated Polderman et al. 2015 paper.

I also noticed this other blog post about the genomics in psychiatry (HT @elo81).  The context here is a little different.  However, the article where I first heard about Myriad's GeneSight had a subtitle that implied some confusion in the ability of this pharmacogenetic test to be used for diagnosis (which was not what the content of the article showed: you may be able to use genetics to guide testing different medications, but I didn't see any evidence that this particular test could diagnosis whether you actually have depression).  Additional, this article says "United HealthCare in August announced that it will cover panels of genetic test for guiding the use of drugs for major depression and other depressive disorders, although the American Psychiatric Association’s research council last year concluded that the evidence for testing in those indications is not conclusive", which I believe is specifically in reference to GeneSight?  Either way, the end of this article has two citations (Zeier et al. 2018 and Zubenko et al. 2018) that discuss the field (the later of which describes clinical trials for GeneSight).

In general, you can also find some information on ClinicalTrials.gov (for GeneSight).  While some results are more clear than others, I thought this was interesting.  For example, I think one was "Completed" but actually canceled (under "Results Submitted")?  One is recruiting in Canada (this is for the US National Library of Medicine).  Some can be complete yet have "No Results Posted" (as opposed to not having results because the study still active).  In fact, there was only one with results (NCT01610063, out of the 10 from my search), and it has a link in the original table of search results (to make it stand out more).

There were twice as many lost to follow-up for the Guided (using GeneSight) versus Unguided treatment, but I don't know how often that happens.  The difference for "primary outcome" (and multiple secondary outcomes) was greater for red category results than green/yellow combined category (which matches my expectation that what would give me the most confidence was for me to have a red result and test taking the medication - even though I don't recommend that for most people, particularly if you have no good reason to take such a risk).  I certainly don't want to downplay being able to identify adverse side effects better in 15-20% of patients (if I understand that correctly, that does matter, particularly if you consistently see that between independent cohorts), but I also don't want people to think that the method was precise enough to predict exactly what they should take on the first try.

Third, I am sure I would be guilty of this if I tried to write an entire book (and this is part of why I have "change logs" on my blog posts), but there were some situations where I think there was some room for improvement in the wording.  For example, I think there are some valid points within sections like "Parents Matter, But They Don't Make A Difference" (page 82 in the paperback edition) or "Schools Matter, But They Don't Make A Difference" (page 86 in the paperback edition), but there was understandably some complaints described in the afterword (page 191 in the paperback edition).

For example, on the positive side, the explanation of what is and what can be (at a population measure, as being reported in these studies) that is described several times in the book (including, but not limited to, page 192 in the paperback addition) is useful advice that I have used at least one time when making a point in causal conversation.  However, using statistics as an incentive for change is different than than presenting fate as highly deterministic from genetics (and therefore predictive regardless of future action), and I think this is a caveat that may require less emphasis on the predictive power (and therefore hopefully avoid the need for this additional explanation).

In terms of sections like "Life Experiences Matter, But They Don't Make A Difference" (page 89 in the paperback edition), I think Plomin is right to discourage people from being overly worried about small mistakes.  However, figuring out what life experiences are traumatic enough to need extra effort to avoid is important.  It is also my opinion that convergence of traits like personality and mental health over a long enough period of time can perhaps be though of like needing to go through developmental stages (even as an adult), where certain concepts are easier to understand after you have gone through certain first-hand experiences.  In other words, I believe having some sort of anchor for clear understanding can be important for preventing certain problems; while I agree with tacking these issues as early as possible, I would therefore disagree that certain traits / diseases can be prevented from birth (if experience / communicating / logic are required to understand the underlying problem and modify behavior).

I also think it is extremely important that Plomin acknowledges "Severe genetic problems such as single-gene or chromosomal problems or severe environmental problems such as neglect or abuse can have devastating effects on children's cognitive and emotional development.  But these devastating genetic and environmental events are, fortunately, rare and do not account for much variance in the population" (page 85 in the paperback edition).  However, I think this may also get back to some limitation in the heritabiltiy measure for cystic fibrosis (a single-gene disorder that I believe is one of better examples some thing that can realistically be prevented with methods like IVF+PGT).

Likewise, I thought an insightful example was provided in the Afterword on page 197 in the paperback edition: "No prediction is perfect, especially in behavioral sciences.  We often make big decisions on the basis of much weaker correlations.  For example, the correlation between blood alcohol levels and automobile accidents is weak, but that doesn't, and shouldn't deter us from making strict laws about drunk-driving."  I do wonder if perhaps choosing a title other than "blueprint: how DNA makes us who we are" would have helped with the "No prediction is perfect" part, but that is also discussed in the Afterword (on page 190-191 in the paperback edition).

Fourth, on page 180 in the paperback edition, Plomin mentions "dating websites might extend their data to include polygenic scores...Unlike the hype of dating websites, polygenic-score information could be verifiable through password-protected links to a direct-to-consumer company".  While the limits to predictive power in "percent match" on dating websites might be a good analogy to the limits to "hypothesis generation" for some genomics applications, I certainly wouldn't encourage something like this.  Plus, I'm not quite as certain about the genomics verification being foolproof (which also means that I would at least somewhat disagree with the sentence on page 181 that "You can't fake or train your DNA").  For example, I had a strange experience when I uploaded my 23andMe data into FamilyTreeDNA, and Francis Collins was able to submit his DNA sample under another name to mutiple companies (as described in the prologue to The Language of Life, which is a book that I admittedly prefer, and I have a blog post with an updated summary of thoughts as well as a set of discussion questions for a book club).

Similarly, I have some concerns about the suggestion of using polygenic risk scores for job interviews (mentioned on page 181 of the paperback version), even though I certainly acknowledge limitations in fairly accessing somebody during a brief screening / interview process.

To be clear, I don't expect any system to be completely foolproof (kind of like it is possible to pay somebody to take your SATs, but that is rare and we have only heard about wealthy people doing that).  However, I still strongly disagree with using PRS for dating apps or job applications, which I believe is in line with the view that PRS should usually not be used for embryo selection.

Finally, on a closing note, the Afterword has a section called "Public Reaction" (pages 199 in the paperback edition).  Plomin describes a highly positive response after describing critiques from scientists and the media: "Far from the nightmare predicted before publication, the public reaction has been positive beyond my wildest dreams."  However, my concern that individuals with less background in an area may initially have a more positive reaction, but those individuals may have a more negative reaction in the long run (if there were limitations that were not made clear to them, especially if they repeated incorrect or imprecise information to others).  While I realize this can make success hard to define, I think this may be important for many genomics researchers and companies.

Change Log:

9/7/2019 - public post date
9/8/2019 - fix typos; minor changes
9/16/2019 - add early link to book; minor changes
9/20/2019 - add pre-print citation
10/1/2019 - add other review link + minor subsequent changes
10/2/2019 - add links related to GeneSight
10/20/2019 - add ClinicalTrials.org links
11/14/2019 - add link to swirl lesson with Galton's height data.
7/6/2020  - change tense for "polygenic risk score" label
7/9/2022  - provide alternative BMI scatterplot, and modify content accordingly; minor changes

Also, I moved the following paragraph out of the main text, given that I found it somewhat confusing on re-reading (even if the view of the variation might in fact be of some interest):

Similarly, I thought it was interesting to see Sir Francis Galton's parent-child height data in the "1: Introduction" lesson in the swirl course for "Regression Models" (the scatter for what I believe is one of the most heritable traits is still noticeable and the data is being brought up in terms of describing regression towards a mean).  Also, if you work interactively the data, I thought it was useful to deviate a bit from the instructions and create a plot using smoothScatter(galton$child ~ galton$parent).  Also, to be clear, you should expect more variability for a parent-child plot than a MZ/DZ twin plot.

Also, for reasons of brevity, I thought it might help to move out the following content (and re-number the later sections):

Third, I thought it was a bit odd that the author referenced an error in the afterword without actually correcting it.  Namely, on page 113 in the paperback edition, Plomin says "[if] a SNP is associated with a psychological trait, that means the SNP was expressed."  If the variant changes the protein coding sequence, then expression of that gene is important.  However, I remember Plomin also mentioning that variants for psychological traits are often located in non-coding regions: "most DNA associations with psychological traits involve SNPs in non-coding regions of DNA rather than in classical genes" (page 116 of the paperback edition).  Without getting into whether that is actually causing more false positives for those associations, intergenic or promoter variants do not need to be expressed themselves (in order to affect expression of a causal gene).  This is also mentioned in the Afterword (page 198 in the paperback edition) in the context of epigenetic regulation, but I am a little confused about the counter-argument to epigenetic regulation (except to say some variability, like drug resistance, can be caused through epigenetic mechanisms that won't be captured by Polygenic Risk Scores) and I don't see anything explicitly saying "the SNP doesn't have to be expressed" particularly if a lot of SNPs are in non-coding regions.

Also, it is probably a minor point, but I have some issues with the sentence "[the] rest of this book focuses on SNPs, because they have played a central role in the DNA revolution" (page 113 of the paperback edition) because i) certain classes of SNPs can be called with higher accuracy than indels (insertions and deletions) but I think indels may on average have a greater effect on function in coding regions (kind of like saying "you only searched for your keys under the street light because that is where you could see best") and ii) something about "DNA revolution" strikes me as something generally associated with hype (even if there are contexts where that truly is a fair representation of the advancements in technology and medicine).  This 2nd point is kind of like calling the discovery of the double-helix by Watson and Crick as "the most important ever produced in biology" (page 110 in the paperback edition).

I also noticed that the predictive power of the Fabbri et al. 2019 PRS for resistance to depression treatment was not very impressive, but that may relate to epigenetic changes (getting back to the Afterword comment).

Sunday, August 4, 2019

Concerns About Using Low-Coverage Sequencing for Trait or Health Results

This is a subset of my notes from my Nebula lcWGS sequencing on GitHub:

NOTE (2/24/2020): Nebula is currently offering 30x sequencing.  So, my concerns about the low coverage Whole Genome Sequencing (lcWGS) at ~0.5x are probably less relevant for that particular company.  However, if you get lcWGS from another company, then this information is probably relevant.

Concerns about Specific Variants

While I very much support providing FASTQ, BAM and VCF data, one of my concerns about the Nebula results was the use of low-coverage sequencing.

So, one of the first things that I did was visualize the alignments for some of my more confidently understood variants from previous data (using IGV).

For the two alignments below, the Genos Exome is the top alignment, the Nebula low-coverage alignment is in the middle, and the Veritas Whole Genome Sequencing (WGS, regular-coverage) is at the bottom.

My cystic fibrosis variant (rs121908769):


My APOE Alzhiemer's risk variant (rs429358, Nebula alignment in middle, variant is red-blue bar in the right-most exon):


For APOE, I zoomed out from the screenshot so that you could get a better perspective of the error rate per-read at other positions around the gene.

You could see my cystic fibrosis variant in the 1 read covered at that position, but you can't see any reads with the APOE variant.  My concern about the use of low-coverage sequencing is due to imputation (at least for traits).  Even though this APOE variant is somewhat common (I believe ~15% of the population), the imputation failed to identify me as having that variant.  You see that from the .vcf files

My APOE Alzhiemer's risk variant:

19      45411941        rs429358        T       C       .       PASS    .       GT:RC:AC:GP:DS  0/0:0:0:0.923102,0.0768962,1.71523e-06:0.0768996

As described in the gVCF header:

GT = Genotype
RC = Count of Reads with Ref Allele
AC = Count of reads with Alt Allele
GP = Genotype Probability: Pr(0/0), Pr(1/0), Pr(1/1)
DS = Estimated Alternate Allele Dosage

The "0/0" (for genotype/GT in the last column) means that low-coverage imputation couldn't detect my APOE variant.  In other words, I believe Nebula incorrectly estimates my genotype to be 0/0 with a probability of 92.3%, and the probably for the true genotype was 7.7%.  I also see a blog post mentioning that these probabilities are provided to users through the web-interface, although I am having difficulty in finding them without the gVCF (and you won't see them in the PDFs that I have uploaded in this section).

Update (8/5): Nebula support got in touch with me and explained that the blog post is in reference to Nebula Research Library (rather than the "Your Traits" section).  I canceled my subscription, I am still able to confirm that I see this under the "Library" section (rather than "Traits," "Ancestry," or "Microbiome").

Likewise, there was no delTT variant in the VCF, so my cystic fibrosis carrier status would also be a false negative (if that was used in the report), even though you could actually see that deletion in the 1 read aligned at that position (because 1 read wasn't sufficient to have confidence in that variant).

Overall Variant Concordance

I can also use my VCF_recovery.pl script to compare recovery of my Veritas WGS variants in my Nebula gVCF.

If you compare SNPs, then the accuracy is noticeably lower than GATK (and even lower than DeepVariant):


3,071,596 / 3,419,611 (89.8%) full SNP recovery
3,184,641 / 3,419,611 (93.1%) partial SNP recovery

The indels are harder to compare (becuase of the freebayes indel format).  So, in the interests of fairness, I am omiting them here (as I did for comparing the provided Genos Exome versus Veritas WGS variants).  However, instead of comparing the provided Veritas WGS .vcf file, I can try comparing the BWA-MEM re-aligned GATK Veritas WGS .vcf (which also had higher concordance between my Exome and WGS datasets):


3,133,635 / 3,419,611 (91.6%) full SNP recovery
3,248,277 / 3,419,611 (95.0%) partial SNP recovery
164,140 / 217,959 (75.3%) full insertion recovery
180,736 / 217,959 (82.9%) partial insertion recovery
190,452 / 266,479 (71.5%) full deletion recovery
213,131 / 266,479 (80.0%) partial deletion recovery

The GATK recovery is a little better.  However, it is very important to emphasize that the gVCF variants do not have 99% accuracy (even for average accuracy, or even for SNPs).  I think whatever benchmark was used for that calculation was probably over-fit on some training data.  To be fair, I think the average SNP chip concordance (with higher coverage WGS data) is also lower than some people might expect, but it is definitely higher than this lcWGS data.

You can also show similar results with precisonFDA (using the BWA-MEM realigned GATK gVCF, which we expect to have better concordance than the provided Veritas gVCF).

For example, the overall file shows noticably low recall when comparing the Nebula imputed gVCF versus the Veritas WGS BWA-MEM re-aligned gVCF:


and, to be more fair for the Exome versus WGS comparison in the blog post, the trend is similar within RefSeq CDS regions:


The screenshots are smaller than in the blog post because there was no precision-recall plot for the Imputed Nebula gVCF comparisons.

So, I  disagree with the use of low-coverage sequencing for traits, and I would respectfully consider removing this section (or only made available to those with higher-coverage sequencing).

When I was trying to upload my raw data to my Personal Genome Project page, I noticed that they had an option called "genetic data - Gencove low pass (e.g. Nebula Genomics)".  This makes me think discouraging low-coverage sequencing is something that needs to be done more broadly (at least for health traits).


Concerns abut Nebula Library Results

My concerns for the previous sections are probably solved when using the higher coverage sequencing data.  So, unless you were an earlier customer and had the lower coverage sequencing data, you probably don't have to be extra careful about possibly overestimated accuracy in your genotype imputations.

However, there is one thing that I think could still be a problem for customers with higher coverage sequencing data (if the reports are the same).  The concept is similar to my concern about the basepaws breed index (described in this blog post) and/or other Polygenic Risk Scores that I have collected for myself, but I think I can explain my concern with the top 3 percentile results that I received from Nebula:


As you can see from this link, the percentile above was calculated using 13 SNPs.  Seven of the thirteen SNPs are on chromosome 6, and 5/7 of those variants didn't have alignments against the main reference chrososome (for hg19) in my higher coverage Veritas Whole Genome Sequencing data.  Nebula predicted 3-4 of those 7 chromosome 6 variants to be homozygous variants, but I am not sure if these are correct or not (and the nucleotide for rs3763312 was different from the variants in dbSNP).  There were a pair of variants on chromosome 10 where I was predicted to be heterozgyous at both sites.  For the remaining 6 non-chr6 variants, I had imputed genotypes for 2 heterozygous variants, 2 homozygous non-reference variants, and 2 homozygous reference variants (and they matched my higher coverage WGS data).

I am only 34, but I definitely don't have hair that looks like the Google images for this disease.  So, I don't know the expected age of onset, but I think I might never get this condition (even though Nebula says that I am at the 100th percentile).


As you can see from this link, the percentile above was calculated using 15 SNPs.  12 of those SNPs had at least 1 variant from the reference genome and 11/12 of those variants matched by Vertias WGS variants.  The discordant variant was rs6910071, which was homozygous for the variant allele on the Nebula lcWGS imputed variants.  So, this could have been consistent with 90% overall accuracy, but I didn't have coverage for either dataset at this position (so, this isn't the same as using a gVCF to make a homozygous reference genotype call).

I have osteoarthritis in my lower back, but I don't believe that I (currently) have rheumatoid arthritis.

While I could believe that I am at increased risk, it is important to note that the summary only describes 4% of variance in disease risk.  I think this should be described for all of the reports, to give a sense of the predictive power (along with other statistics).

I also noticed most of the variants were not present in ClinVar (when I was using dbSNP to check the hg19 genome coordinates and reference allele).


As you can see from this link, the percentile above was calculated using 56 SNPs.

I have blood test results uploaded on my PatientsLikeMe profile, and I thought that I had a normal CRP result.  However, it appears that I might not have remembered that correctly, and I might need to wait until my next checkup to see if I can test my CRP level.  However, this is something where I think it would be relatively easy to show if being at the 99% percentile substantially affects your observed CRP levels (or whether there are limits to what this score represents).


As you can see from this link, the percentile above was calculated using 6 SNPs.  Nebula predicted that I had a homozygous variant for 1 SNP and heterozygous variant for 1 SNP (and reference genotypes for the other 4 variants).  However, all of these variants looked OK in my higher coverage Veritas WGS data.

I believe that I have been previously reported to be at higher risk for restless leg syndrome, but that might have actually been for deep vein thrombosis / venous thromboembolism in the earlier 23andMe reports (before the FDA required approval for a more select set of results).  I do sometimes have difficult sitting perfectly still at night.  However, this does't happen all of the time, and I have never been diagnosed by a doctor for having this condition.  So, I would currently lean towards saying that I don't have restless leg syndrome.

For the 2 sets of SNPs that I checked (for alopecia areata and restless leg syndrome), I also visualized my Genos Exome alignment.  However, most of the variants were not covered by sequencing of coding regions.

In general, the journals where these results are published may make some readers think the results are useful.  However, being able to publish a result in a prestigious journal doesn't mean the associations are predictive enough to be clinically meaningful.  Also, even with a more subtle association, being in a prestigious journal doesn't necessarily mean the result can be reproduced.  For example, there are retractions in high impact journals (you can see some in this blog post), and there are objectively wrong conclusions in papers that haven't been retracted (and the science-wide error rate is mentioned in this blog post).  I don't want to cause unnecessarily alarm, but I think it is important to emphasize that time and large sample sizes (and independent validation) are needed to become comfortable with using genetic results to guide your medical treatment.

Nebula does provide a warning: "Disclaimer: Nebula Library is for research, information, and educational use only. This information is not medical advice, nor is it intended to be used for any diagnostic purpose. Please seek the assistance of a health care provider with any questions regarding your health."  However, I think this is easy to miss and the importance may not be fully understood among all customers.

Additional Note #1: I tried to provide a review for Nebula on Trustpilot, but I have encountered some difficulties.  You can see a screenshot of the current review (that was not accepted) here.  While I still haven't gotten a response for the last attempt to submit a review and get an explanation of what I need to change.  While I am not certain if this is the cause, the link that I received to submit a review initially created a review under another name.  To be fair, Nebula did pay me the $10 Amazon gift card (even when I provided a screenshot of a 2-star review, when most are 4- or 5-star reviews), and I hope that this review can eventually be posted (in which case, I will provide a link to that review, instead of this longer explanation).

Additional Note #2: You can see my report to FDA MedWatch (MW5093887) in MAUDE here.  I received an acknowledgement via mail for another report, but I just looked for this report after waiting a while.

Update Log:

8/4/2019 - public post date
8/5/2019 - add update about Nebula research library
8/6/2019 - minor changes
8/10/2019 - add link for 23andMe SNP chip versus WGS concordance
8/14/2019 - minor changes
8/15/2019 - minor changes; add box around APOE variant
8/16/2019 - minor changes
8/17/2019 - revise title (to better emphasize importance, but also presentation of just my own data)
8/16/2019 - minor changes
11/26/2019 - add arrows to Nebula samples in IGV screenshots
1/26/2020 - add screenshot of Trustpilot review
2/24/2020 - mention that Nebula is currently offering higher coverage sequencing
3/19/2020 - add concerns about Nebula Library (to match what I described in my MedWatch report)
3/20/2020 - add links to SNP details for selected library results
3/22/2020 - add link to other PRS post
4/18/2020 - add notes about checking RA post
4/24/2020 - add notes about FDA MedWatch submission
4/26/2020 - minor changes
7/6/2020 - minor changes "Polygenic Risk Score" label, for the last part of the blog post.
 
Creative Commons License
Charles Warden's Science Blog by Charles Warden is licensed under a Creative Commons Attribution-NonCommercial-NoDerivs 3.0 United States License.